Page 276 - Process Equipment and Plant Design Principles and Practices by Subhabrata Ray Gargi Das
P. 276

10.4 Design illustration  277


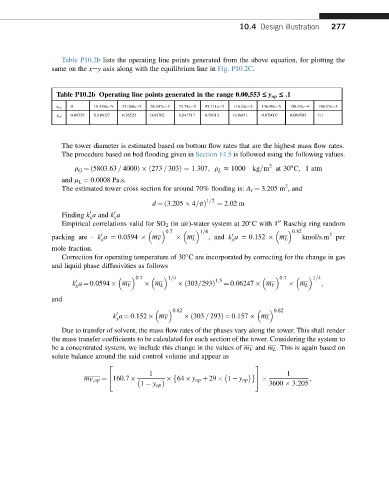
                  Table P10.2b lists the operating line points generated from the above equation, for plotting the
               same on the xey axis along with the equilibrium line in Fig. P10.2C.


                 Table P10.2b Operating line points generated in the range 0.00,553 £ y op £ .1
                     0     18.339ee5  37.068ee5  56.197ee5  75.74ee5  95.711ee5  116.12ee5  136.99ee5  158.34ee4  180.17ee5
                 x op
                     0.00553  0.016027  0.26523  0.03702  0.047517  0.58013  0.06851  0.079007  0.089503  0.1
                 y op


                  The tower diameter is estimated based on bottom flow rates that are the highest mass flow rates.
                  The procedure based on bed flooding given in Section 14.5 is followed using the following values.
                                                                            3     o
                      r ¼ð5803:63 = 4000Þ ð273 = 303Þ¼ 1:307; r z 1000  kg=m at 30 C; 1 atm
                       G                                     L
                  and m L ¼ 0.0008 Pa.s.
                                                                                2
                  The estimated tower cross section for around 70% flooding is: A t ¼ 3.205 m , and
                                                          1=2
                                                             ¼ 2:02 m
                                           d ¼ð3:205   4=pÞ
                  Finding k a and k a
                                 0
                          0
                          x      y
                  Empirical correlations valid for SO 2 (in air)-water system at 20 C with 1 Raschig ring random

                                                                              00
                                                0:7       1=4                      0:82     2
                                                                 0
                             0
               packing are - k a ¼ 0:0594   m V     m L    , and k a ¼ 0:152   m L   kmol/s.m per
                             x                                   x
               mole fraction.
                  Correction for operating temperature of 30 C are incorporated by correcting for the change in gas

               and liquid phase diffusivities as follows
                                       0:7      1=4                            0:7      1=4

                                                             1:5
                      0                                                                   ;
                     k a ¼ 0:0594   m V    m L     ð303=293Þ   ¼ 0:06247   m V     m L
                      x
               and
                                                 0:82                        0:82

                                k a ¼ 0:152   m V    ð303 = 293Þ¼ 0:157   m L
                                 0
                                 x
                  Due to transfer of solvent, the mass flow rates of the phases vary along the tower. This shall render
               the mass transfer coefficients to be calculated for each section of the tower. Considering the system to
               be a concentrated system, we include this change in the values of m V and m L . This is again based on
               solute balance around the said control volume and appear as
                               2                                        3
                                          1                            	         1
                               4                  64   y op þ 29   1   y op  5         ;
                        m V;op ¼ 160:7
                                        1   y op                            3600   3:205
   271   272   273   274   275   276   277   278   279   280   281