
Page 274 - Process Equipment and Plant Design Principles and Practices by Subhabrata Ray Gargi Das
P. 274
10.4 Design illustration 275
pressure slightly above the atmospheric pressure. Design the scrubber with 1 100 Raschig rings,
2
o
randomly packed. The equilibrium data (mole fraction) for SO 2 e air - water system at 30 C is given in
Table P10.2a.
Table P10.2a Equilibrium data (mole fraction) for SO 2 eairewater system at 30 C.
x 0 5.62e e 5 14.03e e 5 28.0e e 5 42.2e e 5 56.4e e 5 84.2e e 5 140.3e e 5 196.5e e 5 279.0e e 5
y 0 0.79e e 3 2.23e e 3 6.19e e 3 10.65e e 3 15.5e e 3 25.9e e 3 47.3e e 3 68.5e e 3 104.0e e 3
Basis: 1 hr.
The equilibrium curve is drawn on the xey axis.
For minimum L/G operation.
Gas inlet: y 1 ¼ 0.1; kmol SO 2 at inlet ¼ 400/22.4 ¼ 17.86; kg SO 2 at inlet ¼ 64 17.86 ¼ 1143.04.
Water inlet: x 2 ¼ 0.1, kmol SO 2 at inlet water ¼ 0; kg SO 2 at inlet ¼ 0.
To use minimum water, exit concentration of SO 2 in exiting liquid (x 1 ) should be maximum. This is
possible when x 1 is in equilibrium with y 1 . Hence, x 1 ¼ 0.0027, read from the equilibrium curve
obtained from Table P10.2a.
r Minimum water inflow ¼ L min ¼ (17.86 e 0.893) / (0.0027 e 0) ¼ 6267.103 kmol.
It is checked that a straight line joining (x 1 ,y 1 ) and (x 2 ,y 2 ) does not touch/intersect the equilibrium
curve at any intermediate point within ordinate limit y 1 to y 2 . This confirms that there is no pinch point
in this case, and the reduction of concentration from y 1 to y 2 is possible.
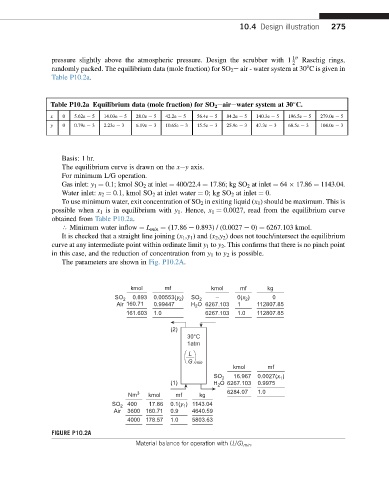
The parameters are shown in Fig. P10.2A.
kmol mf kmol mf kg
SO 2 0.893 0.00553(y ) SO 2 – 0(x ) 0
2
2
Air 160.71 0.99447 H O 6267.103 1 112807.85
2
161.603 1.0 6267.103 1.0 112807.85
(2)
30°C
1atm
L
G min
kmol mf
SO 2 16.967 0.0027(x )
1
(1) H O 6267.103 0.9975
2
Nm 3 kmol mf kg 6284.07 1.0
400 17.86 ) 1143.04
SO 2 0.1(y 1
Air 3600 160.71 0.9 4640.59
4000 178.57 1.0 5803.63
FIGURE P10.2A
Material balance for operation with (L/G) min .