
Page 252 - Process Modelling and Simulation With Finite Element Methods
P. 252
Geometric Continuation 239
Since unit concentration is actually scaled by the initial uniform surfactant
concentration in the layer prior to evaporation commencing, it is reasonable to
vary the isotherm parameters m and yo to see the effect of changing the initial
surfactant loading. Figure 6.16(b) tests this for Pe=l. This figure looks
superimposable on Figure 6.12, with the exception that the vertical scale is
stretched to accommodate the maximum surfactant concentration at 1.25%
elevation, rather than the 0.75% with steeper isotherm (Figure 6.12).
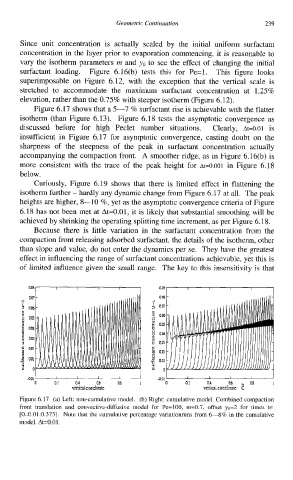
Figure 6.17 shows that a 5-7 % surfactant rise is achievable with the flatter
isotherm (than Figure 6.13). Figure 6.18 tests the asymptotic convergence as
discussed before for high Peclet number situations. Clearly, Ak0.01 is
insufficient in Figure 6.17 for asymptotic convergence, casting doubt on the
sharpness of the steepness of the peak in surfactant concentration actually
accompanying the compaction front. A smoother ridge, as in Figure 6.16(b) is
more consistent with the trace of the peak height for At=0.001 in Figure 6.18
below.
Curiously, Figure 6.19 shows that there is limited effect in flattening the
isotherm further - hardly any dynamic change from Figure 6.17 at all. The peak
heights are higher, 8-10 %, yet as the asymptotic convergence criteria of Figure
6.18 has not been met at At=0.01, it is likely that substantial smoothing will be
achieved by shrinking the operating splitting time increment, as per Figure 6.18.
Because there is little variation in the surfactant concentration from the
compaction front releasing adsorbed surfactant, the details of the isotherm, other
than slope and value, do not enter the dynamics per se. They have the greatest
effect in influencing the range of surfactant concentrations achievable, yet this is
of limited influence given the small range. The key to this insensitivity is that
I
I I I I
I
I I I I I I I I
0.4
06
01 04 06 08 I O! vcltiml cominatc E 08 I
vtrtiml coordinate
Figure 6.17 (a) Left: non-cumulative model. (b) Right: cumulative model. Combined compaction
front translation and convective-diffusive model for Pe=100, m=0.7, offset y0=2 for times ts
[0.:0.01:0.375]. Note that the cumulative percentage variationruns from 6-8% in the cumulative
model. At=O.Ol.