
Page 249 - Process Modelling and Simulation With Finite Element Methods
P. 249
236 Process Modelling and Simulation with Finite Element Methods
concentration associated with the compaction front is highest exactly at the front,
and diminishes in height, as there is greater penetration downward of the
surfactant flux released upon compaction (modelled by the point source term).
As the compaction front approaches the bottom, the no flux boundary condition
forces surfactant to accumulate along the bottom. It should be noted that the
elevation in surfactant concentration does not reach 1% in this example. Perhaps
the strength of diffusion keeps the compaction front broad and dilute in this
example. The cumulative model, shown in Figure 6.13, shows a stronger
aggregate effect, with maximum concentrations of up to 4%.
vcnicel coordinate
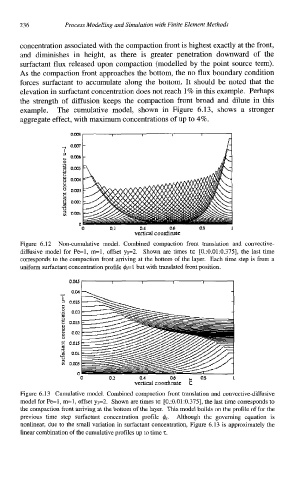
Figure 6.12 Non-cumulative model. Combined compaction front translation and convective-
diffusive model for Pe=l, m=l, offset y0=2. Shown are times tE [0.:0.01:0.375], the last time
corresponds to the compaction front arriving at the bottom of the layer. Each time step is from a
uniform surfactant concentration profile q3s=1 but with translated front position.
0 0.2 0.4 06 08 1
vcnical coordinate E
Figure 6.13 Cumulative model. Combined compaction front translation and convective-diffusive
model for Pe=l, m=l, offset y0=2. Shown are times te [0.:0.01:0.375], the last time corresponds to
the compaction front arriving at the bottom of the layer. This model builds on the profile of for the
previous time step surfactant concentration profile q5s. Although the governing equation is
nonlinear, due to the small variation in surfactant concentration, Figure 6.13 is approximately the
linear combination of the cumulative profiles up to time T.