
Page 250 - Process Modelling and Simulation With Finite Element Methods
P. 250
Geometric Continuation 237
An Irish professor once remarked to me, “Anyone can do a calculation, the trick
is figuring out if it’s right.” So how do we know that the cumulative model,
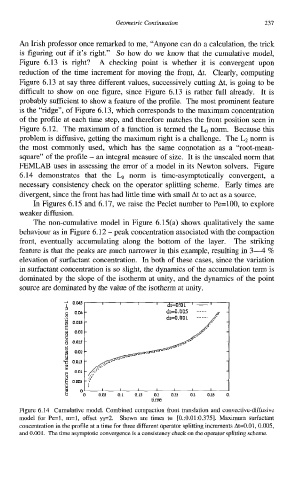
Figure 6.13 is right? A checking point is whether it is convergent upon
reduction of the time increment for moving the front, At. Clearly, computing
Figure 6.13 at say three different values, successively cutting At, is going to be
difficult to show on one figure, since Figure 6.13 is rather full already. It is
probably sufficient to show a feature of the profile. The most prominent feature
is the “ridge”, of Figure 6.13, which corresponds to the maximum concentration
of the profile at each time step, and therefore matches the front position seen in
Figure 6.12. The maximum of a function is termed the Lo norm. Because this
problem is diffusive, getting the maximum right is a challenge. The L2 norm is
the most commonly used, which has the same connotation as a “root-mean-
square” of the profile - an integral measure of size. It is the unscaled norm that
FEMLAB uses in assessing the error of a model in its Newton solvers. Figure
6.14 demonstrates that the Lo norm is time-asymptotically convergent, a
necessary consistency check on the operator splitting scheme. Early times are
divergent, since the front has had little time with small At to act as a source.
In Figures 6.15 and 6.17, we raise the Peclet number to Pe=100, to explore
weaker diffusion.
The non-cumulative model in Figure 6.15(a) shows qualitatively the same
behaviour as in Figure 6.12 - peak concentration associated with the compaction
front, eventually accumulating along the bottom of the layer. The striking
feature is that the peaks are much narrower in this example, resulting in 3-4 %
elevation of surfactant concentration. In both of these cases, since the variation
in surfactant concentration is so slight, the dynamics of the accumulation term is
dominated by the slope of the isotherm at unity, and the dynamics of the point
source are dominated by the value of the isotherm at unity.
Figure 6.14 Cumulative model. Combined compaction front translation and convective-diffusive
model for Pe=l, m=l, offset y0=2. Shown are times tc [0.:0.01:0.375]. Maximum surfactant
concentration in the profile at a time for three different operator splitting increments At=O.Ol, 0.005,
and 0.001. The time asymptotic convergence is a consistency check on the operator splitting scheme.