
Page 319 - Process Modelling and Simulation With Finite Element Methods
P. 319
306 Process Modelling and Simulation with Finite Element Methods
Time I 1
Mar 006y
Time = 2
OC6
3-
25- 0 04
2- 0 02
15- 0
1- 0 02
05- 0 04
I/ I I , , , , I n. I, 1 , , , I , I , , , I 0 06
-25 -2 -15 .1 -05 0 05 1 -25 -2 -15 .1 -05 0 05 1 15 2 25 Mn 00555
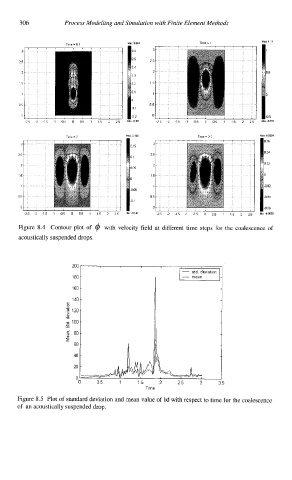
Figure 8.4 Contour plot of @ with velocity field at different time steps for the coalescence of
acoustically suspended drops.
200
1 SO
160
140
m
c
5 120
m
100
Lo
5 80
2
60
40
20
0
0 05 1 15 2 25 3
Time
Figure 8.5 Plot of standard deviation and mean value of Id with respect to time for the coalescence
of an acoustically suspended drop.