Page 321 - Process Modelling and Simulation With Finite Element Methods
P. 321

308        Process Modelling and Simulation with Finite Element Methods


                                       1918            Time = 1        Max  0284
          3                            3                                0 25
                                                                        02
          25                           2                                0 15
                                                                        01
          2                            1                                0 05
                                                                        0
          15
                                                                        405
          1                                                             01
                                       1
                                                                        0 15
          05                                                            02
                                       2
                                                                        ox
          0
           25   2   15   1   05   0   05   1   15   2   25   1289      *In 0291
                                                       Time = 5
          3                           01    3
                                                                        0 02
                                      008
                                                                        0015
          25                          006   25
                                                                        001
                                      0 04
          2                                 2
                                      om                                0 om
                                                                        0
          15                               15
                                       OD2                              om
          1                            OM                               0 01
                                      OD6
          05                               05                           0015
                                       OM
                                                                        0 02
          0                            01   0
           25   2   15   1   06   0   05   1   15   2   25  M"  0107   25   2   15   1   05  o   05   I   15   2   25  Mn  O  m
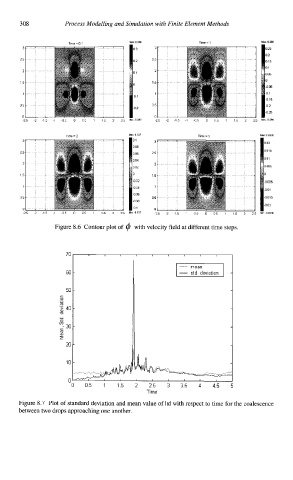
                   Figure 8.6  Contour plot of  f$  with velocity field at different time steps.
                     70
                                                 I - std  deviation  I
                                                     mean
                     60
                     50
                    -
                    c
                    0
                    -
                    m
                     40
                    m
                    u
                    (0
                     30
                    m
                    2
                     20
                      10
                       O   05   1   15   2   25   3   35   4   45   5
                                          Time
         Figure 8.7  Plot of standard deviation and mean value of Id with respect to time for the coalescence
          between two drops approaching one another.
   316   317   318   319   320   321   322   323   324   325   326