
Page 138 - Process simulation and control using Aspen
P. 138
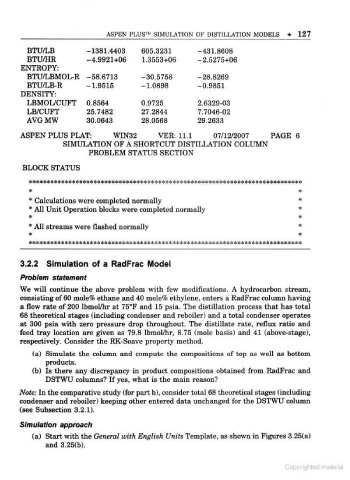
ASPEN PLUS    SIMULATION OF DISTILLATION MODELS        127

         BTU/LB           - 1381.4403    605.3231        -431.8608
         BTU/HR           -4 9921+06      1 .3553+06     -2 .5275+06
                            .
       ENTROPY:
         BTU/T.RMOL-R     -58.6713       -30.5758        -28.8269
         BTU/LB-R         -1 . 9515      -1 .0898        -0 .9851
       DENSITY:
         LBMOiyCUFT       0 . 8564       0 . 9725        2 .6329-03
         LB/CUFT          25.7482        27.2844         7 . 7046-02
         AVGMW            30.0643        28.0568         29.2633

       ASPEN PLUS PLAT:          WIN32        VER: 11.1       07/12/2007      PAGE 6
                   SIMULATION OF A SHORTCUT DISTILLATION COLUMN
                          PROBLEM STATUS SECTION

       BLOCK STATUS


         *                                                                            *
         *
           Calculations were completed normally                                       *
         *
           All Unit Operation blocks were completed normally                          *
         «                                                                            *
         *
           All streams were flashed normally                                          *
         «                                                                            #


       3 .2 .2  Simulation of a RadFrac Model

       Problem statement
       We will continue the above problem with few modifications. A hydrocarbon stream,
       consisting of 60 mole% ethane and 40 mole% ethylene, enters a RadFrac column having
       a flow rate of 200 Ibmol/hr at 750F and 15 psia. The distillation process that has total
       68 theoretical stages (including condenser and reboiler) and a total condenser operates
                                                                            f
       at 300 psia with zero pressure drop throughout. The distillate rate, relux ratio and
       feed tray location are given as 79.8 Ibmol/hr, 8.75 (mole basis) and 41 (above-stage),
       respectively. Consider the RK-Soave property method.

          (a) Simulate the column and compute the compositions of top as well as bottom
              products.
          (b) Is there any discrepancy in product compositions obtained from RadFrac and
              DSTWU columns? If yes, what is the main reason?

       Note: In the comparative study (for part b), consider total 68 theoretical stages (including
       condenser and reboiler) keeping other entered data unchanged for the DSTWU column
       (see Subsection 3.2.1).

       Simulation approach
          (a) Start with the General with English Units Template, as shown in Figures 3.25(a)
              and 3.25(b).