
Page 129 - Psychological Management of Individual Performance
P. 129
case study II 109
by document analysis, individual interviews, group interviews, and written survey. This
evaluation produced the following results:
Humanresourcesworkisbasedonthoroughreflectionanditsserviceshavebeenenlarged.
Human resources work is professional and has a more proactive/counseling character.
Various “clients” of the personnel department rate the changes as positive.
The levels of competence and work satisfaction of the employees have increased.
Collaboration and cooperation within the department have improved significantly.
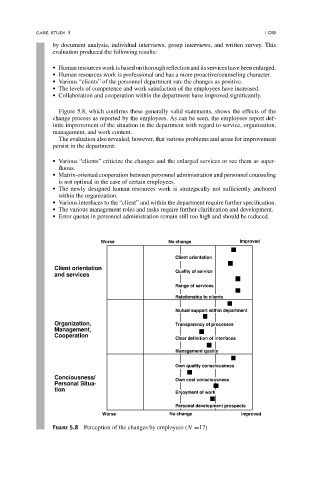
Figure 5.8, which confirms these generally valid statements, shows the effects of the
change process as reported by the employees. As can be seen, the employees report def-
inite improvement of the situation in the department with regard to service, organization,
management, and work content.
The evaluation also revealed, however, that various problems and areas for improvement
persist in the department:
Various “clients” criticize the changes and the enlarged services or see them as super-
fluous.
Matrix-oriented cooperation between personnel administration and personnel counseling
is not optimal in the case of certain employees.
The newly designed human resources work is strategically not sufficiently anchored
within the organization.
Various interfaces to the “client” and within the department require further specification.
The various management roles and tasks require further clarification and development.
Error quotas in personnel administration remain still too high and should be reduced.
Worse No change Improved
Client orientation
Client orientation Quality of service
and services
Range of services
Relationship to clients
Mutual support within department
Organization, Transparency of processes
Management,
Cooperation
Clear definition of interfaces
Management quality
Own quality consciousness
Conciousness/ Own cost consciousness
Personal Situa-
tion
Enjoyment of work
Personal development prospects
Worse No change Improved
FIGURE 5.8 Perception of the changes by employees (N =17)