
Page 88 - How America's Best Places to Work Inspire Extra Effort in Extraordinary Times
P. 88
Steering the Ship and Inspiring the Crew C75
that time the company had, by coincidence, 150 employees. Its overall
score was truly outstanding, a tribute to the quality of its leadership.
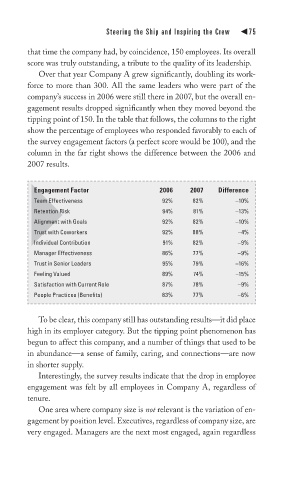
Over that year Company A grew significantly, doubling its work-
force to more than 300. All the same leaders who were part of the
company’s success in 2006 were still there in 2007, but the overall en-
gagement results dropped significantly when they moved beyond the
tipping point of 150. In the table that follows, the columns to the right
show the percentage of employees who responded favorably to each of
the survey engagement factors (a perfect score would be 100), and the
column in the far right shows the difference between the 2006 and
2007 results.
: 2006 2007 Difference
Engagement Factor
92%
Team Effectiveness
82%
–10%
–13%
Retention Risk
94%
81%
–10%
92%
82%
Alignment with Goals
Trust with Coworkers
–9%
Individual Contribution 92% 88% –4%
82%
91%
Manager Effectiveness 86% 77% –9%
Trust in Senior Leaders 95% 79% –16%
Feeling Valued 89% 74% –15%
Satisfaction with Current Role 87% 78% –9%
People Practices (Benefits) 83% 77% –6%
To be clear, this company still has outstanding results—it did place
high in its employer category. But the tipping point phenomenon has
begun to affect this company, and a number of things that used to be
in abundance—a sense of family, caring, and connections—are now
in shorter supply.
Interestingly, the survey results indicate that the drop in employee
engagement was felt by all employees in Company A, regardless of
tenure.
One area where company size is not relevant is the variation of en-
gagement by position level. Executives, regardless of company size, are
very engaged. Managers are the next most engaged, again regardless