
Page 106 - Renewable Energy Devices and System with Simulations in MATLAB and ANSYS
P. 106
Overview of PV Maximum Power Point Tracking Techniques 93
Constant irradiation,
decreasing temperature
Constant temperature,
increasing irradiation
output power, P pv
PV array P / V >0
pv
pv
pv
pv
MPP: P / V <0
P / V =0
pv
pv
(a) PV array output voltage, V pv
Global MPP
Local MPP
output power, P pv
PV array Local MPP
(b) PV array output voltage, V pv
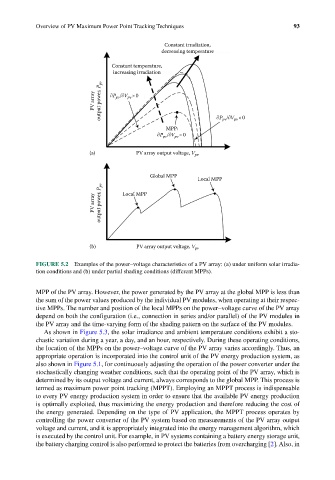
FIGURE 5.2 Examples of the power–voltage characteristics of a PV array: (a) under uniform solar irradia-
tion conditions and (b) under partial shading conditions (different MPPs).
MPP of the PV array. However, the power generated by the PV array at the global MPP is less than
the sum of the power values produced by the individual PV modules, when operating at their respec-
tive MPPs. The number and position of the local MPPs on the power–voltage curve of the PV array
depend on both the configuration (i.e., connection in series and/or parallel) of the PV modules in
the PV array and the time-varying form of the shading pattern on the surface of the PV modules.
As shown in Figure 5.3, the solar irradiance and ambient temperature conditions exhibit a sto-
chastic variation during a year, a day, and an hour, respectively. During these operating conditions,
the location of the MPPs on the power–voltage curve of the PV array varies accordingly. Thus, an
appropriate operation is incorporated into the control unit of the PV energy production system, as
also shown in Figure 5.1, for continuously adjusting the operation of the power converter under the
stochastically changing weather conditions, such that the operating point of the PV array, which is
determined by its output voltage and current, always corresponds to the global MPP. This process is
termed as maximum power point tracking (MPPT). Employing an MPPT process is indispensable
to every PV energy production system in order to ensure that the available PV energy production
is optimally exploited, thus maximizing the energy production and therefore reducing the cost of
the energy generated. Depending on the type of PV application, the MPPT process operates by
controlling the power converter of the PV system based on measurements of the PV array output
voltage and current, and it is appropriately integrated into the energy management algorithm, which
is executed by the control unit. For example, in PV systems containing a battery energy storage unit,
the battery charging control is also performed to protect the batteries from overcharging [2]. Also, in