
Page 109 - Renewable Energy Devices and System with Simulations in MATLAB and ANSYS
P. 109
96 Renewable Energy Devices and Systems with Simulations in MATLAB and ANSYS ®
®
MPP
PV array output current (I pv ), or power (P pv )
R s I pv Current–voltage
+ curve
I ph R p V pv Power–voltage
curve
–
(a) (b) PV array output voltage, V pv
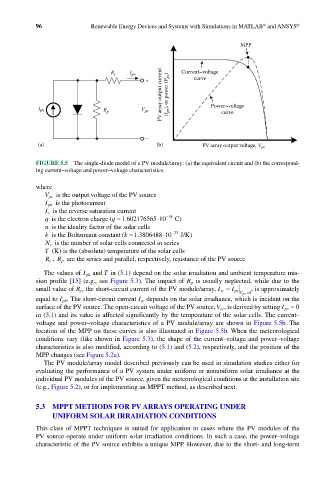
FIGURE 5.5 The single-diode model of a PV module/array: (a) the equivalent circuit and (b) the correspond-
ing current–voltage and power–voltage characteristics.
where
V pv is the output voltage of the PV source
I ph is the photocurrent
I s is the reverse saturation current
q is the electron charge (q = 1 .602176565 ⋅10 −19 C )
n is the ideality factor of the solar cells
k is the Boltzmann constant (k = 1 .3806488 ⋅10 −23 J/K )
N s is the number of solar cells connected in series
K
T () is the (absolute) temperature of the solar cells
R s , R p are the series and parallel, respectively, resistance of the PV source
The values of I ph and T in (5.1) depend on the solar irradiation and ambient temperature mis-
sion profile [15] (e.g., see Figure 5.3). The impact of R p is usually neglected, while due to the
small value of R s , the short-circuit current of the PV module/array, I sc = , is approximately
I pv
V pv =0
equal to I ph . The short-circuit current I sc depends on the solar irradiance, which is incident on the
surface of the PV source. The open-circuit voltage of the PV source, V oc , is derived by setting I pv = 0
in (5.1) and its value is affected significantly by the temperature of the solar cells. The current–
voltage and power–voltage characteristics of a PV module/array are shown in Figure 5.5b. The
location of the MPP on these curves is also illustrated in Figure 5.5b. When the meteorological
conditions vary (like shown in Figure 5.3), the shape of the current–voltage and power–voltage
characteristics is also modified, according to (5.1) and (5.2), respectively, and the position of the
MPP changes (see Figure 5.2a).
The PV module/array model described previously can be used in simulation studies either for
evaluating the performance of a PV system under uniform or nonuniform solar irradiance at the
individual PV modules of the PV source, given the meteorological conditions at the installation site
(e.g., Figure 5.2), or for implementing an MPPT method, as described next.
5.3 MPPT METHODS FOR PV ARRAYS OPERATING UNDER
UNIFORM SOLAR IRRADIATION CONDITIONS
This class of MPPT techniques is suited for application in cases where the PV modules of the
PV source operate under uniform solar irradiation conditions. In such a case, the power–voltage
characteristic of the PV source exhibits a unique MPP. However, due to the short- and long-term