Page 159 - Renewable Energy Devices and System with Simulations in MATLAB and ANSYS
P. 159

146             Renewable Energy Devices and Systems with Simulations in MATLAB  and ANSYS ®
                                                                                ®

                         400
                                                              Energy yield per month
                         350

                         300
                       Energy yield (kWh)  200
                         250


                         150

                         100

                          50
                           0
                             Jan  Feb  Mar  Apr  May  Jun  Jul  Aug  Sep  Oct  Nov  Dec

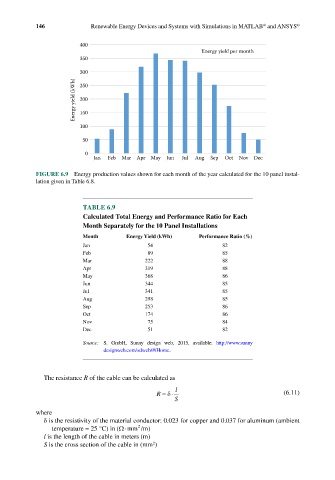
            FIGURE 6.9  Energy production values shown for each month of the year calculated for the 10 panel instal-
            lation given in Table 6.8.


                          TABLE 6.9
                          Calculated Total Energy and Performance Ratio for Each
                          Month Separately for the 10 Panel Installations
                          Month        Energy Yield (kWh)    Performance Ratio (%)
                          Jan                54                     82
                          Feb                89                     85
                          Mar                222                    88
                          Apr                319                    88
                          May                368                    86
                          Jun                344                    85
                          Jul                341                    85
                          Aug                298                    85
                          Sep                253                    86
                          Oct                174                    86
                          Nov                75                     84
                          Dec                51                     82

                          Source:   S.  GmbH,  Sunny  design  web,  2015,  available:  http://www.sunny
                                designweb.com/sdweb/#/Home.


              The resistance R of the cable can be calculated as
                                                      l
                                                   δ
                                                R =⋅                                  (6.11)
                                                     S
            where
              δ is the resistivity of the material conductor: 0.023 for copper and 0.037 for aluminum (ambient
                                          2
                 temperature = 25 °C) in (Ω⋅mm /m )
              l is the length of the cable in meters (m)
                                               2
              S is the cross section of the cable in (mm )
   154   155   156   157   158   159   160   161   162   163   164