
Page 162 - Renewable Energy Devices and System with Simulations in MATLAB and ANSYS
P. 162
Design of Residential Photovoltaic Systems 149
100 1979 CdTe
Global module average selling price (USD/Wp) 10 1 1992 1998 2011 2014 2011 2015
c-Si
2002
2004
0.10
1 10 100 1,000 10,000 100,000 1,000,000
Cumulative production volume (MW)
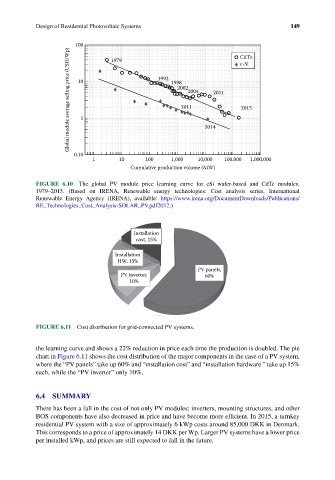
FIGURE 6.10 The global PV module price learning curve for cSi wafer-based and CdTe modules,
1979–2015. (Based on IRENA, Renewable energy technologies: Cost analysis series, International
Renewable Energy Agency (IRENA), available: https://www.irena.org/DocumentDownloads/Publications/
RE_Technologies_Cost_Analysis-SOLAR_PV.pdf2012.)
Installation
cost, 15%
Installation
HW, 15%
PV panels,
PV inverter, 60%
10%
FIGURE 6.11 Cost distribution for grid-connected PV systems.
the learning curve and shows a 22% reduction in price each time the production is doubled. The pie
chart in Figure 6.11 shows the cost distribution of the major components in the case of a PV system,
where the “PV panels” take up 60% and “installation cost” and “installation hardware ” take up 15%
each, while the “PV inverter” only 10%.
6.4 SUMMARY
There has been a fall in the cost of not only PV modules; inverters, mounting structures, and other
BOS components have also decreased in price and have become more efficient. In 2015, a turnkey
residential PV system with a size of approximately 6 kWp costs around 85,000 DKK in Denmark.
This corresponds to a price of approximately 14 DKK per Wp. Larger PV systems have a lower price
per installed kWp, and prices are still expected to fall in the future.