
Page 295 - Renewable Energy Devices and System with Simulations in MATLAB and ANSYS
P. 295
282 Renewable Energy Devices and Systems with Simulations in MATLAB and ANSYS ®
®
Energy period, Te [sec]
3.5 4.5 5.5 6.5 7.5 8.5 9.5 10.5 11.5 12.5 13.5 14.5 15.5 16.5 17.5 18.5 19.5 20.5
0.25 0.02 0.03
0.75 0.02 0.46 1.49 2.68 1.91 1.10 0.53 0.17 0.02
1.25 0.01 0.59 4.11 5.56 4.48 2.74 1.28 0.67 0.33 0.07 0.02 0.02
1.75 0.12 3.27 5.14 4.62 3.93 2.11 1.24 0.76 0.31 0.10 0.03
Significant wave height, Hs [m] 3.25 0.45 1.54 1.47 1.96 1.42 0.79 0.32 0.11 0.04 0.02 0.01 0.01
0.92 5.25 3.68 4.14 2.87 1.31 0.84 0.42 0.20 0.08 0.02
2.25
0.14 2.43 2.60 2.82 2.85 1.57 0.80 0.32 0.14 0.06 0.02
2.75
3.75
0.05 0.49 0.63 1.08 1.01 0.63 0.29 0.10 0.05 0.02
0.09 0.21 0.45 0.56 0.42 0.21 0.07 0.02 0.02
4.25
4.75
0.02 0.08 0.12 0.26 0.27 0.19 0.07 0.02 0.01
0.03 0.03 0.11 0.15 0.13 0.07 0.02
5.25
0.02 0.07 0.05 0.05 0.02
5.75
6.25
6.75
0.02 0.02
7.25
7.75 0.03 0.04 0.02 0.01
8.25
8.75
4.1 5.2 6.4 7.5 8.7 9.9 11.0 12.2 13.3 14.5 15.7 16.8 18.0 19.1 20.3 21.5 22.6 23.8
Peak period, Tp [sec]
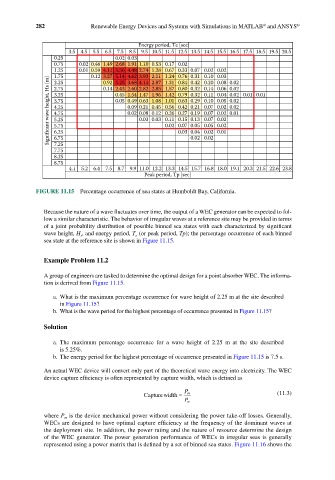
FIGURE 11.15 Percentage occurrence of sea states at Humboldt Bay, California.
Because the nature of a wave fluctuates over time, the output of a WEC generator can be expected to fol-
low a similar characteristic. The behavior of irregular waves at a reference site may be provided in terms
of a joint probability distribution of possible binned sea states with each characterized by significant
wave height, H s , and energy period, T e (or peak period, Tp); the percentage occurrence of each binned
sea state at the reference site is shown in Figure 11.15.
Example Problem 11.2
A group of engineers are tasked to determine the optimal design for a point absorber WEC. The informa-
tion is derived from Figure 11.15.
a. What is the maximum percentage occurrence for wave height of 2.25 m at the site described
in Figure 11.15?
b. What is the wave period for the highest percentage of occurrence presented in Figure 11.15?
Solution
a. The maximum percentage occurrence for a wave height of 2.25 m at the site described
is 5.25%.
b. The energy period for the highest percentage of occurrence presented in Figure 11.15 is 7.5 s.
An actual WEC device will convert only part of the theoretical wave energy into electricity. The WEC
device capture efficiency is often represented by capture width, which is defined as
Capturewidth = P m (11.3)
P w
where P m is the device mechanical power without considering the power take-off losses. Generally,
WECs are designed to have optimal capture efficiency at the frequency of the dominant waves at
the deployment site. In addition, the power rating and the nature of resource determine the design
of the WEC generator. The power generation performance of WECs in irregular seas is generally
represented using a power matrix that is defined by a set of binned sea states. Figure 11.16 shows the