
Page 308 - Reservoir Formation Damage
P. 308
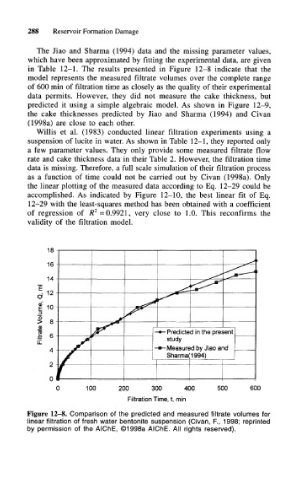
288   Reservoir Formation Damage

                  The  Jiao  and  Sharma  (1994)  data  and  the  missing parameter  values,
                which have been  approximated by  fitting  the experimental  data,  are given
                in  Table  12-1.  The  results  presented  in  Figure  12-8  indicate  that  the
                model  represents  the  measured  filtrate volumes  over  the  complete  range
                of  600 min  of filtration time  as closely  as the  quality of their experimental
                data  permits.  However,  they  did  not  measure  the  cake  thickness,  but
                predicted  it  using  a  simple  algebraic  model.  As  shown  in  Figure  12-9,
               the  cake  thicknesses  predicted  by  Jiao  and  Sharma  (1994)  and  Civan
                (1998a)  are  close  to  each  other.
                  Willis  et  al.  (1983)  conducted  linear  filtration  experiments  using  a
                suspension  of lucite in  water. As  shown in Table  12-1, they reported only
                a  few  parameter  values.  They  only  provide  some  measured  filtrate  flow
               rate  and  cake  thickness data  in their Table  2. However, the filtration time
               data is missing. Therefore,  a full  scale  simulation of their filtration process
                as  a  function  of  time  could  not  be  carried  out  by  Civan  (1998a).  Only
               the  linear plotting  of the  measured data  according  to Eq.  12-29  could be
               accomplished.  As  indicated  by  Figure  12-10,  the  best  linear  fit  of  Eq.
                12-29  with the  least-squares  method has  been  obtained  with a  coefficient
               of  regression  of  R 2  = 0.9921,  very  close  to  1.0.  This  reconfirms  the
               validity  of  the  filtration model.


                                                     Predicted in the present
                                                     study
                                                  »- Measured by Jiao and
                                                     Sharma(1994)


                               100      200      300     400      500      600
                                          Filtration Time, t, min
               Figure  12-8.  Comparison  of the  predicted  and  measured filtrate  volumes  for
               linear  filtration  of fresh water  bentonite  suspension  (Civan,  R,  1998;  reprinted
               by  permission  of  the AlChE,  ©1998a AlChE.  All  rights  reserved).