
Page 306 - Reservoir Formation Damage
P. 306
286 Reservoir Formation Damage
0.002
jg 0.0015
c
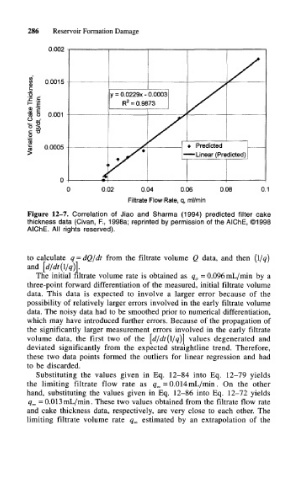
y = 0.0229X - 0.0003
2
R = 0.9873
co o 0.001
O *7
C T3
O
0.0005 * Predicted
— Linear (Predicted)
0.02 0.04 0.06 0.08 0.1
Filtrate Flow Rate, q, ml/min
Figure 12-7. Correlation of Jiao and Sharma (1994) predicted filter cake
thickness data (Civan, R, 1998a; reprinted by permission of the AlChE, ©1998
AlChE. All rights reserved).
to calculate q = dQ/dt from the filtrate volume Q data, and then (\/q)
and [d/dt(l/q)].
The initial filtrate volume rate is obtained as q 0 = 0.096 mL/min by a
three-point forward differentiation of the measured, initial filtrate volume
data. This data is expected to involve a larger error because of the
possibility of relatively larger errors involved in the early filtrate volume
data. The noisy data had to be smoothed prior to numerical differentiation,
which may have introduced further errors. Because of the propagation of
the significantly larger measurement errors involved in the early filtrate
volume data, the first two of the [d/dt (l/q)] values degenerated and
deviated significantly from the expected straightline trend. Therefore,
these two data points formed the outliers for linear regression and had
to be discarded.
Substituting the values given in Eq. 12-84 into Eq. 12-79 yields
the limiting filtrate flow rate as q x =0.014mL/min. On the other
hand, substituting the values given in Eq. 12-86 into Eq. 12-72 yields
q x = 0.013mL/min. These two values obtained from the filtrate flow rate
and cake thickness data, respectively, are very close to each other. The
limiting filtrate volume rate q x estimated by an extrapolation of the