
Page 301 - Reservoir Formation Damage
P. 301
Cake Filtration: Mechanism, Parameters and Modeling 281
conventional techniques. These are the permeability K c and porosity § c
of the filter cake, and the deposition and erosion rate constants k d and
k e, and the critical shear-stress i cr for the particles. However, given the
3
experimental measurements of the filtrate volume <2(cm ), or rate q
3
(cm /s), and the filter cake thickness 6 as functions of the filtration time
t, some of these parameters can be determined by means of the diagnostic
charts constructed as described in the following. These are presented
separately for the linear and radial filtration processes obeying Darcy's
law according to Civan (1998a).
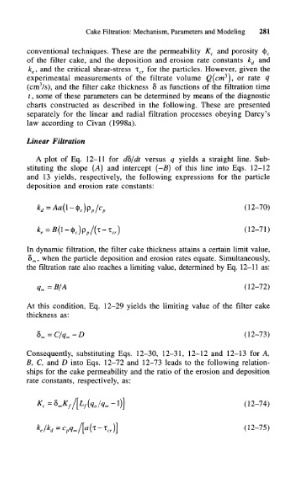
Linear Filtration
A plot of Eq. 12-11 for d&fdt versus q yields a straight line. Sub-
stituting the slope (A) and intercept (-#) of this line into Eqs. 12-12
and 13 yields, respectively, the following expressions for the particle
deposition and erosion rate constants:
k d=Aa(l-$ c)p p/c (12-70)
1 T\ / •% ± \ I / \ / 1 ^ ^ 1 \
= ( ) C /C
k e ^(l~ l c)Pp/V ~ cr) (12-71)
In dynamic filtration, the filter cake thickness attains a certain limit value,
8^, when the particle deposition and erosion rates equate. Simultaneously,
the filtration rate also reaches a limiting value, determined by Eq. 12-11 as:
(12-72)
At this condition, Eq. 12-29 yields the limiting value of the filter cake
thickness as:
(12-73)
Consequently, substituting Eqs. 12-30, 12-31, 12-12 and 12-13 for A,
B, C, and D into Eqs. 12-72 and 12-73 leads to the following relation-
ships for the cake permeability and the ratio of the erosion and deposition
rate constants, respectively, as:
(12-74)
(12-75)