
Page 205 - Reservoir Geomechanics
P. 205
187 Compressive and tensile failures in vertical wells
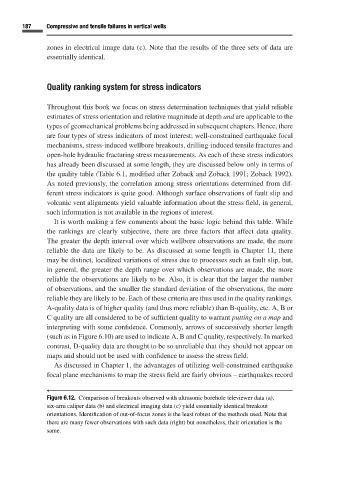
zones in electrical image data (c). Note that the results of the three sets of data are
essentially identical.
Quality ranking system for stress indicators
Throughout this book we focus on stress determination techniques that yield reliable
estimates of stress orientation and relative magnitude at depth and are applicable to the
types of geomechanical problems being addressed in subsequent chapters. Hence, there
are four types of stress indicators of most interest; well-constrained earthquake focal
mechanisms, stress-induced wellbore breakouts, drilling-induced tensile fractures and
open-hole hydraulic fracturing stress measurements. As each of these stress indicators
has already been discussed at some length, they are discussed below only in terms of
the quality table (Table 6.1, modified after Zoback and Zoback 1991; Zoback 1992).
As noted previously, the correlation among stress orientations determined from dif-
ferent stress indicators is quite good. Although surface observations of fault slip and
volcanic vent alignments yield valuable information about the stress field, in general,
such information is not available in the regions of interest.
It is worth making a few comments about the basic logic behind this table. While
the rankings are clearly subjective, there are three factors that affect data quality.
The greater the depth interval over which wellbore observations are made, the more
reliable the data are likely to be. As discussed at some length in Chapter 11, there
may be distinct, localized variations of stress due to processes such as fault slip, but,
in general, the greater the depth range over which observations are made, the more
reliable the observations are likely to be. Also, it is clear that the larger the number
of observations, and the smaller the standard deviation of the observations, the more
reliable they are likely to be. Each of these criteria are thus used in the quality rankings.
A-quality data is of higher quality (and thus more reliable) than B-quality, etc. A, B or
C quality are all considered to be of sufficient quality to warrant putting on a map and
interpreting with some confidence. Commonly, arrows of successively shorter length
(such as in Figure 6.10) are used to indicate A, B and C quality, respectively. In marked
contrast, D-quality data are thought to be so unreliable that they should not appear on
maps and should not be used with confidence to assess the stress field.
As discussed in Chapter 1, the advantages of utilizing well-constrained earthquake
focal plane mechanisms to map the stress field are fairly obvious – earthquakes record
←
Figure 6.12. Comparison of breakouts observed with ultrasonic borehole televiewer data (a),
six-arm caliper data (b) and electrical imaging data (c) yield essentially identical breakout
orientations. Identification of out-of-focus zones is the least robust of the methods used. Note that
there are many fewer observations with such data (right) but nonetheless, their orientation is the
same.