
Page 202 - Reservoir Geomechanics
P. 202
184 Reservoir geomechanics
X-STRUCTURE
Z-STRUCTURE
Y-STRUCTURE
0 5 10 mi
0 5 10 km
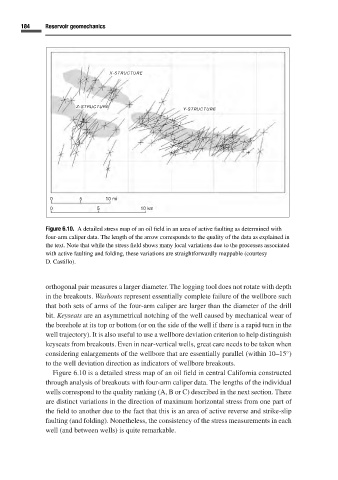
Figure 6.10. A detailed stress map of an oil field in an area of active faulting as determined with
four-arm caliper data. The length of the arrow corresponds to the quality of the data as explained in
the text. Note that while the stress field shows many local variations due to the processes associated
with active faulting and folding, these variations are straightforwardly mappable (courtesy
D. Castillo).
orthogonal pair measures a larger diameter. The logging tool does not rotate with depth
in the breakouts. Washouts represent essentially complete failure of the wellbore such
that both sets of arms of the four-arm caliper are larger than the diameter of the drill
bit. Keyseats are an asymmetrical notching of the well caused by mechanical wear of
the borehole at its top or bottom (or on the side of the well if there is a rapid turn in the
well trajectory). It is also useful to use a wellbore deviation criterion to help distinguish
keyseats from breakouts. Even in near-vertical wells, great care needs to be taken when
◦
considering enlargements of the wellbore that are essentially parallel (within 10–15 )
to the well deviation direction as indicators of wellbore breakouts.
Figure 6.10 is a detailed stress map of an oil field in central California constructed
through analysis of breakouts with four-arm caliper data. The lengths of the individual
wells correspond to the quality ranking (A, B or C) described in the next section. There
are distinct variations in the direction of maximum horizontal stress from one part of
the field to another due to the fact that this is an area of active reverse and strike-slip
faulting (and folding). Nonetheless, the consistency of the stress measurements in each
well (and between wells) is quite remarkable.