
Page 197 - Reservoir Geomechanics
P. 197
a. b.
c.
5400
5600
5800
6000
Depth [feet] 6200
6400
6600
6800 S Hmax (TC)
S Hmax (BO)
7000
7200
0 60 120 180 240 300 360
S Hmax azimuth
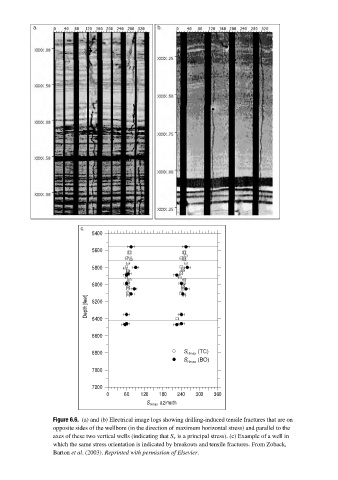
Figure 6.6. (a) and (b) Electrical image logs showing drilling-induced tensile fractures that are on
opposite sides of the wellbore (in the direction of maximum horizontal stress) and parallel to the
axes of these two vertical wells (indicating that S v is a principal stress). (c) Example of a well in
which the same stress orientation is indicated by breakouts and tensile fractures. From Zoback,
Barton et al.(2003). Reprinted with permission of Elsevier.