Page 198 - Reservoir Geomechanics
P. 198

180    Reservoir geomechanics


         a.
                                                     S Hmax
                                              A


                     A-CENTRAL FAULT


                     HIGH REFLECTIVITY
                     DUE TO GAS IN THE        B                       N
                     BRENT RESERVOIR
                                          C


                                                            o
                                                          62 N
                                        D
                                                                                NORWAY
              REDUCED REFLECTIVITY
               DUE TO GAS LEAKAGE
                                                   E
                                                            o
                                                          61 N
                                                   S Hmax
                                                                                 Bergen
                                          0  1  2  3  4  5
                                                                                   o
                                                                         o
                                                                              o
                                                                    o
                                                               o
                                                              2 E  3 E  4 E  5 E  6 E
                                                 Km
                   b.
                     A                B                           Well
                       n = 254          n = 78            A   B   C    D   E


                     S Hmax  = 101° ± 10°  S Hmax  = 102° ± 10°
                     C                D
                        n = 221         n = 618


                     S Hmax  = 107° ± 11°  S Hmax  = 97° ± 9°
                     E
                        n = 90          n = 1261
                                       Data from
                                        all wells
                     S Hmax  = 97° ± 11°  S Hmax  = 100° ± 10°
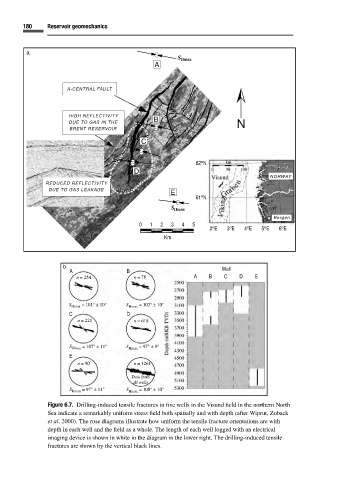
               Figure 6.7. Drilling-induced tensile fractures in five wells in the Visund field in the northern North
               Sea indicate a remarkably uniform stress field both spatially and with depth (after Wiprut, Zoback
               et al. 2000). The rose diagrams illustrate how uniform the tensile fracture orientations are with
               depth in each well and the field as a whole. The length of each well logged with an electrical
               imaging device is shown in white in the diagram in the lower right. The drilling-induced tensile
               fractures are shown by the vertical black lines.
   193   194   195   196   197   198   199   200   201   202   203