
Page 145 - Rock Mechanics For Underground Mining
P. 145
SHEAR BEHAVIOUR OF DISCONTINUITIES
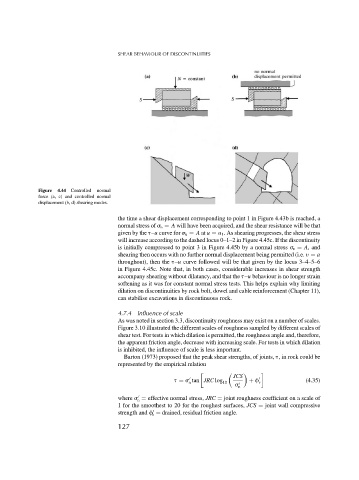
Figure 4.44 Controlled normal
force (a, c) and controlled normal
displacement (b, d) shearing modes.
the time a shear displacement corresponding to point 1 in Figure 4.43b is reached, a
normal stress of n = A will have been acquired, and the shear resistance will be that
given by the –u curve for n = A at u = u 1 . As shearing progresses, the shear stress
will increase according to the dashed locus 0–1–2 in Figure 4.45c. If the discontinuity
is initially compressed to point 3 in Figure 4.45b by a normal stress n = A, and
shearing then occurs with no further normal displacement being permitted (i.e. v = a
throughout), then the –u curve followed will be that given by the locus 3–4–5–6
in Figure 4.45c. Note that, in both cases, considerable increases in shear strength
accompany shearing without dilatancy, and that the –u behaviour is no longer strain
softening as it was for constant normal stress tests. This helps explain why limiting
dilation on discontinuities by rock bolt, dowel and cable reinforcement (Chapter 11),
can stabilise excavations in discontinuous rock.
4.7.4 Influence of scale
As was noted in section 3.3, discontinuity roughness may exist on a number of scales.
Figure 3.10 illustrated the different scales of roughness sampled by different scales of
shear test. For tests in which dilation is permitted, the roughness angle and, therefore,
the apparent friction angle, decrease with increasing scale. For tests in which dilation
is inhibited, the influence of scale is less important.
Barton (1973) proposed that the peak shear strengths, of joints, , in rock could be
represented by the empirical relation
JCS
= tan JRC log 10 + r (4.35)
n
n
where = effective normal stress, JRC = joint roughness coefficient on a scale of
n
1 for the smoothest to 20 for the roughest surfaces, JCS = joint wall compressive
strength and = drained, residual friction angle.
r
127