
Page 140 - Rock Mechanics For Underground Mining
P. 140
ROCK STRENGTH AND DEFORMABILITY
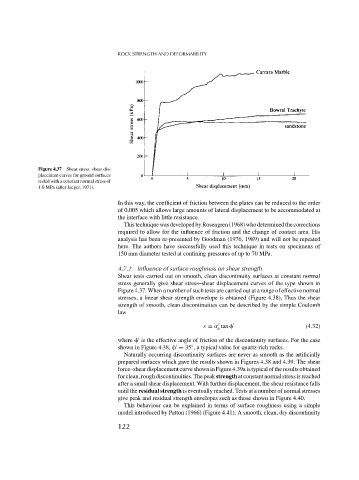
Figure 4.37 Shear stress–shear dis-
placement curves for ground surfaces
tested with a constant normal stress of
1.0 MPa (after Jaeger, 1971).
In this way, the coefficient of friction between the plates can be reduced to the order
of 0.005 which allows large amounts of lateral displacement to be accommodated at
the interface with little resistance.
ThistechniquewasdevelopedbyRosengren(1968)whodeterminedthecorrections
required to allow for the influence of friction and the change of contact area. His
analysis has been re-presented by Goodman (1976, 1989) and will not be repeated
here. The authors have successfully used this technique in tests on specimens of
150 mm diameter tested at confining pressures of up to 70 MPa.
4.7.2 Influence of surface roughness on shear strength
Shear tests carried out on smooth, clean discontinuity surfaces at constant normal
stress generally give shear stress–shear displacement curves of the type shown in
Figure 4.37. When a number of such tests are carried out at a range of effective normal
stresses, a linear shear strength envelope is obtained (Figure 4.38). Thus the shear
strength of smooth, clean discontinuities can be described by the simple Coulomb
law
s = tan (4.32)
n
where is the effective angle of friction of the discontinuity surfaces. For the case
shown in Figure 4.38, = 35 , a typical value for quartz-rich rocks.
◦
Naturally occurring discontinuity surfaces are never as smooth as the artificially
prepared surfaces which gave the results shown in Figures 4.38 and 4.39. The shear
force–sheardisplacementcurveshowninFigure4.39aistypicaloftheresultsobtained
forclean,roughdiscontinuities.Thepeak strengthatconstantnormalstressisreached
after a small shear displacement. With further displacement, the shear resistance falls
until the residual strength is eventually reached. Tests at a number of normal stresses
give peak and residual strength envelopes such as those shown in Figure 4.40.
This behaviour can be explained in terms of surface roughness using a simple
model introduced by Patton (1966) (Figure 4.41). A smooth, clean, dry discontinuity
122