
Page 143 - Rock Mechanics For Underground Mining
P. 143
SHEAR BEHAVIOUR OF DISCONTINUITIES
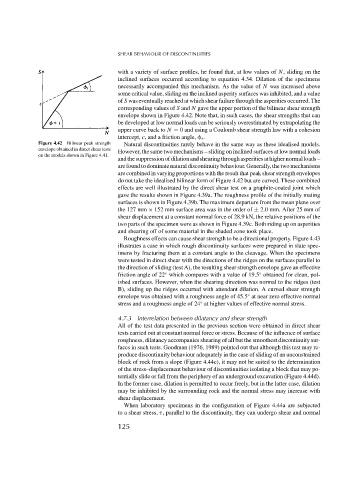
with a variety of surface profiles, he found that, at low values of N, sliding on the
inclined surfaces occurred according to equation 4.34. Dilation of the specimens
necessarily accompanied this mechanism. As the value of N was increased above
some critical value, sliding on the inclined asperity surfaces was inhibited, and a value
of S was eventually reached at which shear failure through the asperities occurred. The
corresponding values of S and N gave the upper portion of the bilinear shear strength
envelope shown in Figure 4.42. Note that, in such cases, the shear strengths that can
be developed at low normal loads can be seriously overestimated by extrapolating the
upper curve back to N = 0 and using a Coulomb shear strength law with a cohesion
intercept, c, and a friction angle, r .
Figure 4.42 Bilinear peak strength Natural discontinuities rarely behave in the same way as these idealised models.
envelope obtained in direct shear tests However, the same two mechanisms – sliding on inclined surfaces at low normal loads
on the models shown in Figure 4.41.
andthesuppressionofdilationandshearingthroughasperitiesathighernormalloads–
are found to dominate natural discontinuity behaviour. Generally, the two mechanisms
are combined in varying proportions with the result that peak shear strength envelopes
do not take the idealised bilinear form of Figure 4.42 but are curved. These combined
effects are well illustrated by the direct shear test on a graphite-coated joint which
gave the results shown in Figure 4.39a. The roughness profile of the initially mating
surfaces is shown in Figure 4.39b. The maximum departure from the mean plane over
the 127 mm × 152 mm surface area was in the order of ± 2.0 mm. After 25 mm of
shear displacement at a constant normal force of 28.9 kN, the relative positions of the
two parts of the specimen were as shown in Figure 4.39c. Both riding up on asperities
and shearing off of some material in the shaded zone took place.
Roughness effects can cause shear strength to be a directional property. Figure 4.43
illustrates a case in which rough discontinuity surfaces were prepared in slate spec-
imens by fracturing them at a constant angle to the cleavage. When the specimens
were tested in direct shear with the directions of the ridges on the surfaces parallel to
the direction of sliding (test A), the resulting shear strength envelope gave an effective
friction angle of 22 which compares with a value of 19.5 obtained for clean, pol-
◦
◦
ished surfaces. However, when the shearing direction was normal to the ridges (test
B), sliding up the ridges occurred with attendant dilation. A curved shear strength
envelope was obtained with a roughness angle of 45.5 at near zero effective normal
◦
◦
stress and a roughness angle of 24 at higher values of effective normal stress.
4.7.3 Interrelation between dilatancy and shear strength
All of the test data presented in the previous section were obtained in direct shear
tests carried out at constant normal force or stress. Because of the influence of surface
roughness, dilatancy accompanies shearing of all but the smoothest discontinuity sur-
faces in such tests. Goodman (1976, 1989) pointed out that although this test may re-
produce discontinuity behaviour adequately in the case of sliding of an unconstrained
block of rock from a slope (Figure 4.44c), it may not be suited to the determination
of the stress–displacement behaviour of discontinuities isolating a block that may po-
tentially slide or fall from the periphery of an underground excavation (Figure 4.44d).
In the former case, dilation is permitted to occur freely, but in the latter case, dilation
may be inhibited by the surrounding rock and the normal stress may increase with
shear displacement.
When laboratory specimens in the configuration of Figure 4.44a are subjected
to a shear stress, , parallel to the discontinuity, they can undergo shear and normal
125