
Page 173 - Rotating Machinery Pratical Solutions to Unbalance and Misalignment
P. 173
Reverse Indicator Alignment
and the E distance to locate the stationary machine dial indica-
tor line. Draw and label this line. All other points are now mea-
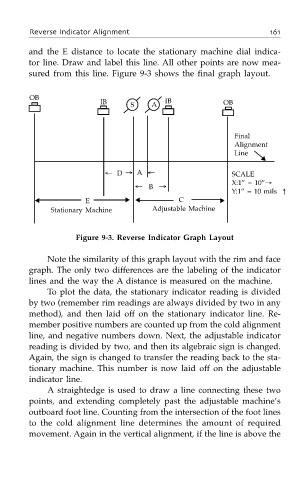
sured from this line. Figure 9-3 shows the final graph layout.
OB
IB IB OB
S A
Final
Alignment
Line
▼
← D → A ← SCALE
X:1” = 10”→
← B →
Y:1” = 10 mils ↑
▲ E ▼ ▲ C ▼
Stationary Machine Adjustable Machine
Figure 9-3. Reverse Indicator Graph Layout
Note the similarity of this graph layout with the rim and face
graph. The only two differences are the labeling of the indicator
lines and the way the A distance is measured on the machine.
To plot the data, the stationary indicator reading is divided
by two (remember rim readings are always divided by two in any
method), and then laid off on the stationary indicator line. Re-
member positive numbers are counted up from the cold alignment
line, and negative numbers down. Next, the adjustable indicator
reading is divided by two, and then its algebraic sign is changed.
Again, the sign is changed to transfer the reading back to the sta-
tionary machine. This number is now laid off on the adjustable
indicator line.
A straightedge is used to draw a line connecting these two
points, and extending completely past the adjustable machine’s
outboard foot line. Counting from the intersection of the foot lines
to the cold alignment line determines the amount of required
movement. Again in the vertical alignment, if the line is above the