
Page 399 - Satellite Communications, Fourth Edition
P. 399
The Space Link 379
As discussed in Chap. 9, a minimum value of [C/N] is required for satis-
factory reception. In the case of frequency modulation, the minimum value
is set by the threshold level of the FM detector, and a threshold margin is
normally allowed, as shown in Fig. 9.12. Sufficient margin must be allowed
so that rain-induced fades do not take the [C/N] below threshold more than
a specified percentage of the time, as shown in Example 12.17.
Example 12.17 In an FM satellite system, the clear-sky downlink [C/N] ratio is
17.4 dB and the FM detector threshold is 10 dB, as shown in Fig. 9.12. (a) Calculate
the threshold margin at the FM detector, assuming the threshold [C/N] is deter-
mined solely by the downlink value. (b) Given that T a 272 K and that T S,CS
544 K, calculate the percentage of time the system stays above threshold. The
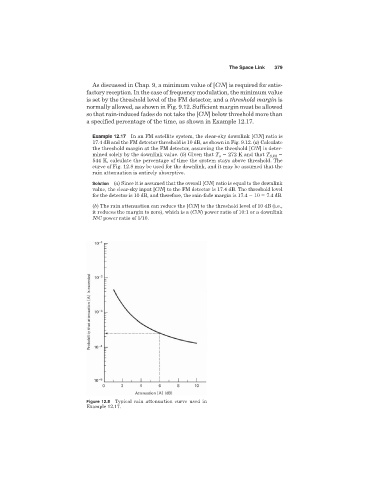
curve of Fig. 12.8 may be used for the downlink, and it may be assumed that the
rain attenuation is entirely absorptive.
Solution (a) Since it is assumed that the overall [C/N] ratio is equal to the downlink
value, the clear-sky input [C/N] to the FM detector is 17.4 dB. The threshold level
for the detector is 10 dB, and therefore, the rain-fade margin is 17.4 10 7.4 dB.
(b) The rain attenuation can reduce the [C/N] to the threshold level of 10 dB (i.e.,
it reduces the margin to zero), which is a (C/N) power ratio of 10:1 or a downlink
N/C power ratio of 1/10.
Figure 12.8 Typical rain attenuation curve used in
Example 12.17.