
Page 401 - Satellite Communications, Fourth Edition
P. 401
The Space Link 381
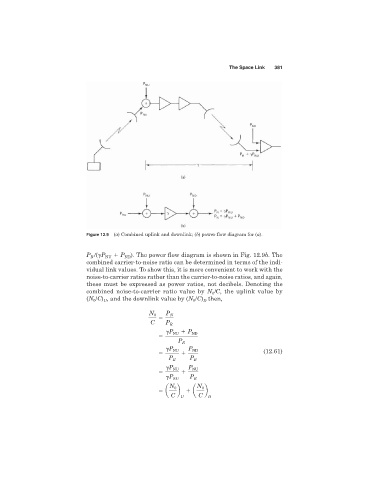
Figure 12.9 (a) Combined uplink and downlink; (b) power flow diagram for (a).
P /( P NU P ND ). The power flow diagram is shown in Fig. 12.9b. The
R
combined carrier-to-noise ratio can be determined in terms of the indi-
vidual link values. To show this, it is more convenient to work with the
noise-to-carrier ratios rather than the carrier-to-noise ratios, and again,
these must be expressed as power ratios, not decibels. Denoting the
combined noise-to-carrier ratio value by N /C, the uplink value by
0
(N /C) , and the downlink value by (N /C) then,
D
0
0
U
P
N 0 N
C P R
P NU P ND
P R
P NU P ND
(12.61)
P R P R
P NU P NU
P RU P R
N N
a 0 b a 0 b
C U C D