
Page 427 - Satellite Communications, Fourth Edition
P. 427
Interference 407
It should be noted that no simple relationship can be given for calcu-
lating the effect of reduced orbital spacing on the overall [C/I]. The sep-
arate uplink and downlink values must be calculated and combined as
described in Sec. 13.2.3. Other telecommunications authorities specify
antenna characteristics that differ from the FCC specifications (see
CCIR Rep. 391–3, 1978).
13.2.5 Passband interference
In the preceding section, the carrier-to-interference ratio at the receiver
input is determined. However, the amount of interference reaching the
detector will depend on the amount of frequency overlap between the
interfering spectrum and the wanted channel passband.
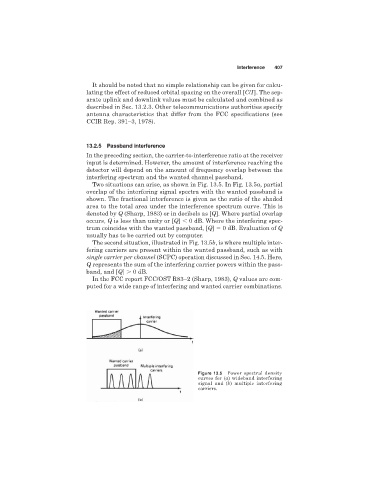
Two situations can arise, as shown in Fig. 13.5. In Fig. 13.5a, partial
overlap of the interfering signal spectra with the wanted passband is
shown. The fractional interference is given as the ratio of the shaded
area to the total area under the interference spectrum curve. This is
denoted by Q (Sharp, 1983) or in decibels as [Q]. Where partial overlap
occurs, Q is less than unity or [Q] 0 dB. Where the interfering spec-
trum coincides with the wanted passband, [Q] 0 dB. Evaluation of Q
usually has to be carried out by computer.
The second situation, illustrated in Fig. 13.5b, is where multiple inter-
fering carriers are present within the wanted passband, such as with
single carrier per channel (SCPC) operation discussed in Sec. 14.5. Here,
Q represents the sum of the interfering carrier powers within the pass-
band, and [Q] 0 dB.
In the FCC report FCC/OST R83–2 (Sharp, 1983), Q values are com-
puted for a wide range of interfering and wanted carrier combinations.
Figure 13.5 Power spectral density
curves for (a) wideband interfering
signal and (b) multiple interfering
carriers.