
Page 185 - Schaum's Outline of Differential Equations
P. 185
168 GRAPHICAL METHODS FOR SOLVING DIFFERENTIAL EQUATIONS [CHAP. 18
Thus,
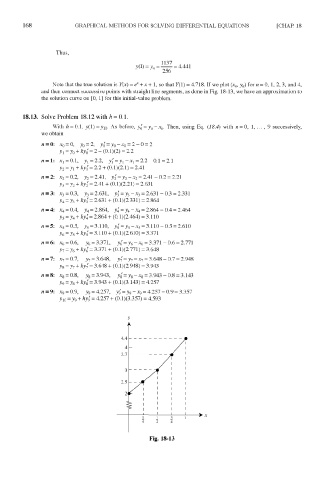
Note that the true solution is Y(x) = a* + x + 1, so that 7(1) = 4.718. If we plot (x n, y n) for n = 0, 1, 2, 3, and 4,
and then connect successive points with straight line segments, as done in Fig. 18-13, we have an approximation to
the solution curve on [0, 1] for this initial-value problem.
18.13. Solve Problem 18.12 with h = 0.1.
With h = 0.1, y(1) = y10. As before, Then, using Eq. (18.4) with n = 0, 1, ..., 9 successively,
we obtain
Fig. 18-13