
Page 157 - Science at the nanoscale
P. 157
RPS: PSP0007 - Science-at-Nanoscale
10:15
June 5, 2009
7.2. The Bottom-Up Approach
G
∆
∆µs
∆
G*
Radius
r*
∆µ v
Total ∆G
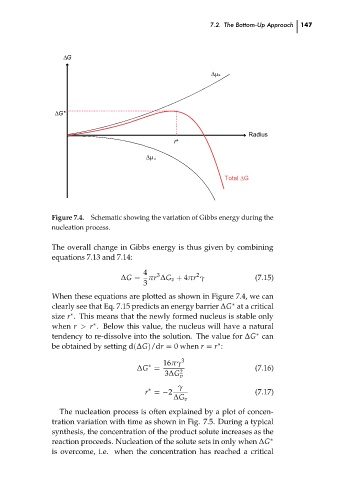
Figure 7.4.
Schematic showing the variation of Gibbs energy during the
nucleation process.
The overall change in Gibbs energy is thus given by combining
equations 7.13 and 7.14:
4
2
3
(7.15)
πr ∆G v + 4πr γ
∆G =
3
When these equations are plotted as shown in Figure 7.4, we can
clearly see that Eq. 7.15 predicts an energy barrier ∆G at a critical
∗
size r . This means that the newly formed nucleus is stable only
∗
when r > r . Below this value, the nucleus will have a natural
∗
tendency to re-dissolve into the solution. The value for ∆G can 147 ch07
∗
be obtained by setting d(∆G)/dr = 0 when r = r :
∗
3
16πγ
∗
∆G = 2 (7.16)
3∆G v
γ
∗
r = −2 (7.17)
∆G v
The nucleation process is often explained by a plot of concen-
tration variation with time as shown in Fig. 7.5. During a typical
synthesis, the concentration of the product solute increases as the
reaction proceeds. Nucleation of the solute sets in only when ∆G ∗
is overcome, i.e. when the concentration has reached a critical