
Page 343 - Sensors and Control Systems in Manufacturing
P. 343
Advanced Sensors in Pr ecision Manufacturing
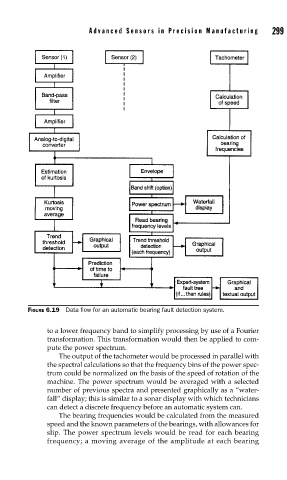
FIGURE 6.19 Data fl ow for an automatic bearing fault detection system. 299
to a lower frequency band to simplify processing by use of a Fourier
transformation. This transformation would then be applied to com-
pute the power spectrum.
The output of the tachometer would be processed in parallel with
the spectral calculations so that the frequency bins of the power spec-
trum could be normalized on the basis of the speed of rotation of the
machine. The power spectrum would be averaged with a selected
number of previous spectra and presented graphically as a “water-
fall” display; this is similar to a sonar display with which technicians
can detect a discrete frequency before an automatic system can.
The bearing frequencies would be calculated from the measured
speed and the known parameters of the bearings, with allowances for
slip. The power spectrum levels would be read for each bearing
frequency; a moving average of the amplitude at each bearing