
Page 342 - Sensors and Control Systems in Manufacturing
P. 342
298
Cha p te r
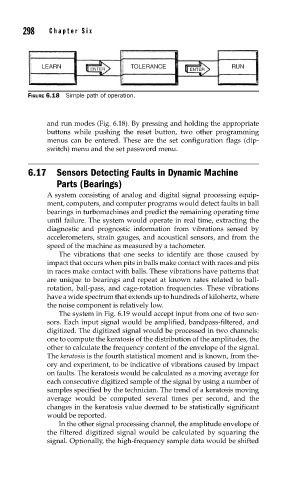
LEARN S i x TOLERANCE RUN
ENTER ENTER
FIGURE 6.18 Simple path of operation.
and run modes (Fig. 6.18). By pressing and holding the appropriate
buttons while pushing the reset button, two other programming
menus can be entered. These are the set configuration flags (dip-
switch) menu and the set password menu.
6.17 Sensors Detecting Faults in Dynamic Machine
Parts (Bearings)
A system consisting of analog and digital signal processing equip-
ment, computers, and computer programs would detect faults in ball
bearings in turbomachines and predict the remaining operating time
until failure. The system would operate in real time, extracting the
diagnostic and prognostic information from vibrations sensed by
accelerometers, strain gauges, and acoustical sensors, and from the
speed of the machine as measured by a tachometer.
The vibrations that one seeks to identify are those caused by
impact that occurs when pits in balls make contact with races and pits
in races make contact with balls. These vibrations have patterns that
are unique to bearings and repeat at known rates related to ball-
rotation, ball-pass, and cage-rotation frequencies. These vibrations
have a wide spectrum that extends up to hundreds of kilohertz, where
the noise component is relatively low.
The system in Fig. 6.19 would accept input from one of two sen-
sors. Each input signal would be amplified, bandpass-filtered, and
digitized. The digitized signal would be processed in two channels:
one to compute the keratosis of the distribution of the amplitudes, the
other to calculate the frequency content of the envelope of the signal.
The keratosis is the fourth statistical moment and is known, from the-
ory and experiment, to be indicative of vibrations caused by impact
on faults. The keratosis would be calculated as a moving average for
each consecutive digitized sample of the signal by using a number of
samples specified by the technician. The trend of a keratosis moving
average would be computed several times per second, and the
changes in the keratosis value deemed to be statistically significant
would be reported.
In the other signal processing channel, the amplitude envelope of
the filtered digitized signal would be calculated by squaring the
signal. Optionally, the high-frequency sample data would be shifted