
Page 557 - Sensors and Control Systems in Manufacturing
P. 557
510
Cha p te r
T e n
Scene Spectral Radiance x x
Spectral Power at Detector
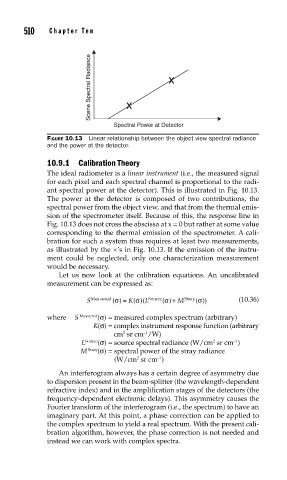
FIGURE 10.13 Linear relationship between the object view spectral radiance
and the power at the detector.
10.9.1 Calibration Theory
The ideal radiometer is a linear instrument (i.e., the measured signal
for each pixel and each spectral channel is proportional to the radi-
ant spectral power at the detector). This is illustrated in Fig. 10.13.
The power at the detector is composed of two contributions, the
spectral power from the object view, and that from the thermal emis-
sion of the spectrometer itself. Because of this, the response line in
Fig. 10.13 does not cross the abscissa at x = 0 but rather at some value
corresponding to the thermal emission of the spectrometer. A cali-
bration for such a system thus requires at least two measurements,
as illustrated by the ×’s in Fig. 10.13. If the emission of the instru-
ment could be neglected, only one characterization measurement
would be necessary.
Let us now look at the calibration equations. An uncalibrated
measurement can be expressed as:
σ
σ
σ
σ
S Measured () = K()( L Sourc e ()+ M Stray ()) (10.36)
where S Measured (σ) = measured complex spectrum (arbitrary)
K(σ) = complex instrument response function (arbitrary
2
–1
cm sr cm /W)
L Source (σ) = source spectral radiance (W/cm sr cm )
–1
2
M Stray (σ) = spectral power of the stray radiance
(W/cm sr cm )
2
–1
An interferogram always has a certain degree of asymmetry due
to dispersion present in the beam-splitter (the wavelength-dependent
refractive index) and in the amplification stages of the detectors (the
frequency-dependent electronic delays). This asymmetry causes the
Fourier transform of the interferogram (i.e., the spectrum) to have an
imaginary part. At this point, a phase correction can be applied to
the complex spectrum to yield a real spectrum. With the present cali-
bration algorithm, however, the phase correction is not needed and
instead we can work with complex spectra.