
Page 553 - Sensors and Control Systems in Manufacturing
P. 553
506
Cha p te r
T e n
ξ = instrument efficiency (no units)
R(σ) = responsivity of the system (A/W)
2
Θ = instrument throughput (cm sr)
F = noise reduction apodization factor (no units);
equal to 1 if no apodization is used
Being incoherent, the various sources of noise are added in an
RSS manner in Eq. (10.11).
10.7.15 Signal-to-Noise Ratio
Finally, the signal-to-noise ratio SNR is given by:
P()σ
SNR()σ = (10.31)
NESR
10.8 Instrument Line Shape and Spectral Resolution
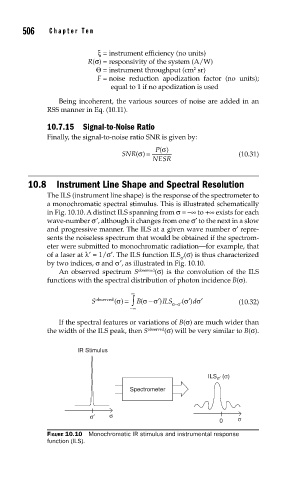
The ILS (instrument line shape) is the response of the spectrometer to
a monochromatic spectral stimulus. This is illustrated schematically
in Fig. 10.10. A distinct ILS spanning from σ = –∞ to +∞ exists for each
wave-number σ′, although it changes from one σ′ to the next in a slow
and progressive manner. The ILS at a given wave number σ′ repre-
sents the noiseless spectrum that would be obtained if the spectrom-
eter were submitted to monochromatic radiation—for example, that
of a laser at λ′ = 1/σ′. The ILS function ILS (σ) is thus characterized
σ′
by two indices, σ and σ′, as illustrated in Fig. 10.10.
An observed spectrum S observed (σ) is the convolution of the ILS
functions with the spectral distribution of photon incidence B(σ).
∞
σ
−
S observed () = ∫ B(σ σ′ ) ILS σσ′ (σ′ d ) σ′ (10.32)
−
−∞
If the spectral features or variations of B(σ) are much wider than
the width of the ILS peak, then S observed (σ) will be very similar to B(σ).
IR Stimulus
ILS σ′ (σ)
Spectrometer
σ′ σ σ
0
FIGURE 10.10 Monochromatic IR stimulus and instrumental response
function (ILS).