
Page 549 - Sensors and Control Systems in Manufacturing
P. 549
502
Cha p te r
T e n
Note: Equating the integrands of two definite integrals cannot be jus-
tified mathematically. A strict derivation would then appeal to the
balance of emitted and absorbed power over an arbitrarily small fre-
quency interval, rather than simply over the full range; this is the
argument Nyquist constructs in Fig. 10.9. There, he considers the fol-
lowing “circuit thought experiment”: Imagine that over all frequencies,
the exchange of power between the two resistors (at equal temperature)
is equal, but over a small range of frequencies, the resistor on the left
radiates more power than it absorbs from that on the right. Then,
introduce a non-dissipative circuit element between the two that
interferes more with the transfer of energy in the frequency range of
interest than in any other range, so that now more total power flows
from the right resistor to the left than in the other direction. But since
the resistors are initially at the same temperature, to let the system
evolve would be to raise the temperature of a hotter thermal body
using the heat of a colder body, by simply introducing a passive cir-
cuit element. So, there must be a “detailed balance” of power over
each tiny range of frequency, in accordance with the second law of
thermodynamics.)
Then, in the classical limit, hω kT,
B
ω
ω
S() ≡ S () = 4 Rk T. (10.23)
V
B
Equation (10.23) shows the Nyquist relation between the voltage
power spectrum and temperature. Accordingly, the current power
spectrum is closely related to the following equation,
ω
ω
B
S () = 1 S () = 4 kT (10.24)
I
V
R 2 R
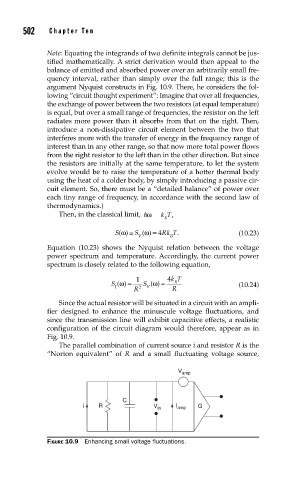
Since the actual resistor will be situated in a circuit with an ampli-
fier designed to enhance the minuscule voltage fluctuations, and
since the transmission line will exhibit capacitive effects, a realistic
configuration of the circuit diagram would therefore, appear as in
Fig. 10.9.
The parallel combination of current source i and resistor R is the
“Norton equivalent” of R and a small fluctuating voltage source,
V amp
C
i R V in I amp G
FIGURE 10.9 Enhancing small voltage fl uctuations.