
Page 119 - Separation process engineering
P. 119
(2.B-1)
By repeating the steps with the x and y columns reversed, the function xeq = g(y) can easily be generated.
(2.B-2)
An alternative to fitting the data is to input the table of data into Excel and then use the “Lookup” function
built into Excel to linearly interpolate between data points.
2.B.2 Binary Flash Distillation with Excel
Once an equation form of the equilibrium data is available, it is relatively easy to develop a spreadsheet
to solve binary flash problems. We need to input the known values, which we will assume are the mole
fraction of the more volatile component in the feed, z, and the fraction vaporized, V/F. Then input the
constants for the VLE data in the form y MVC = f(x MVC ). For this example we will separate ethanol and
water at 1.0 atm with an ethanol feed that is 30 mol% ethanol and V/F = 0.4. The VLE equation for
ethanol-water at 1.0 atm is given by Eq. (2.B-1). Next, input a guessed value for x ethanol . Now calculate
yeq using this value of xguess from Eq. (2.B-1) and calculate yop from Eq. (2-13). Since yop = yeq at the
intersection of the equilibrium and operating curves, eq0 = yeq – yop = 0. Thus, calculate eq0 and use
Goal Seek to make it equal zero by changing the value of xguess. [Note: Goal Seek is hidden in Excel
2007. In the spreadsheet go to Data Tab→What if Analysis→Goal Seek.] The resulting spreadsheet with
cell formulas is listed in Figure 2-B1.
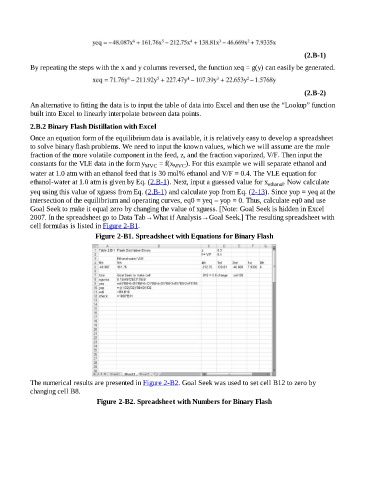
Figure 2-B1. Spreadsheet with Equations for Binary Flash
The numerical results are presented in Figure 2-B2. Goal Seek was used to set cell B12 to zero by
changing cell B8.
Figure 2-B2. Spreadsheet with Numbers for Binary Flash