
Page 166 - Separation process engineering
P. 166
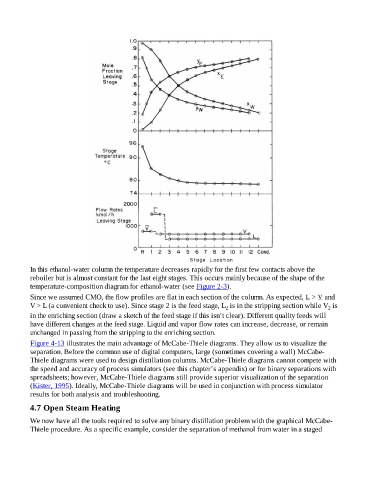
In this ethanol-water column the temperature decreases rapidly for the first few contacts above the
                    reboiler but is almost constant for the last eight stages. This occurs mainly because of the shape of the
                    temperature-composition diagram for ethanol-water (see Figure 2-3).

                    Since we assumed CMO, the flow profiles are flat in each section of the column. As expected,   >   and
                    V > L (a convenient check to use). Since stage 2 is the feed stage, L  is in the stripping section while V  is
                                                                                                2                                       2
                    in the enriching section (draw a sketch of the feed stage if this isn’t clear). Different quality feeds will
                    have different changes at the feed stage. Liquid and vapor flow rates can increase, decrease, or remain
                    unchanged in passing from the stripping to the enriching section.

                    Figure 4-13 illustrates the main advantage of McCabe-Thiele diagrams. They allow us to visualize the
                    separation. Before the common use of digital computers, large (sometimes covering a wall) McCabe-
                    Thiele diagrams were used to design distillation columns. McCabe-Thiele diagrams cannot compete with
                    the speed and accuracy of process simulators (see this chapter’s appendix) or for binary separations with
                    spreadsheets; however, McCabe-Thiele diagrams still provide superior visualization of the separation
                    (Kister, 1995). Ideally, McCabe-Thiele diagrams will be used in conjunction with process simulator
                    results for both analysis and troubleshooting.


                    4.7 Open Steam Heating

                    We now have all the tools required to solve any binary distillation problem with the graphical McCabe-
                    Thiele procedure. As a specific example, consider the separation of methanol from water in a staged