
Page 302 - Shigley's Mechanical Engineering Design
P. 302
bud29281_ch06_265-357.qxd 11/30/2009 4:23 pm Page 277 pinnacle s-171:Desktop Folder:Temp Work:Don't Delete (Jobs):MHDQ196/Budynas:
Fatigue Failure Resulting from Variable Loading 277
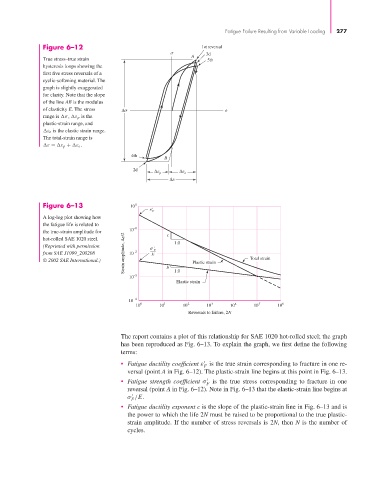
Figure 6–12 1st reversal
3d
A
True stress–true strain 5th
hysteresis loops showing the
first five stress reversals of a
cyclic-softening material. The
graph is slightly exaggerated
for clarity. Note that the slope
of the line AB is the modulus
of elasticity E. The stress Δ
range is σ, ε p is the
plastic-strain range, and
ε e is the elastic strain range.
The total-strain range is
ε = ε p + ε e .
4th
B
2d Δ p Δ e
Δ
Figure 6–13 10 0
' F
A log-log plot showing how
the fatigue life is related to
the true-strain amplitude for 10 –1 c
Strain amplitude, Δ /2 E
hot-rolled SAE 1020 steel.
(Reprinted with permission ' 1.0
from SAE J1099_200208 10 –2 F
© 2002 SAE International.) b Plastic strain Total strain
10 –3 1.0
Elastic strain
10 –4
10 0 10 1 10 2 10 3 10 4 10 5 10 6
Reversals to failure, 2N
The report contains a plot of this relationship for SAE 1020 hot-rolled steel; the graph
has been reproduced as Fig. 6–13. To explain the graph, we first define the following
terms:
• Fatigue ductility coefficient ε is the true strain corresponding to fracture in one re-
F
versal (point A in Fig. 6–12). The plastic-strain line begins at this point in Fig. 6–13.
• Fatigue strength coefficient σ is the true stress corresponding to fracture in one
F
reversal (point A in Fig. 6–12). Note in Fig. 6–13 that the elastic-strain line begins at
σ /E.
F
• Fatigue ductility exponent c is the slope of the plastic-strain line in Fig. 6–13 and is
the power to which the life 2N must be raised to be proportional to the true plastic-
strain amplitude. If the number of stress reversals is 2N, then N is the number of
cycles.