
Page 300 - Shigley's Mechanical Engineering Design
P. 300
bud29281_ch06_265-357.qxd 11/30/2009 4:23 pm Page 275 pinnacle s-171:Desktop Folder:Temp Work:Don't Delete (Jobs):MHDQ196/Budynas:
Fatigue Failure Resulting from Variable Loading 275
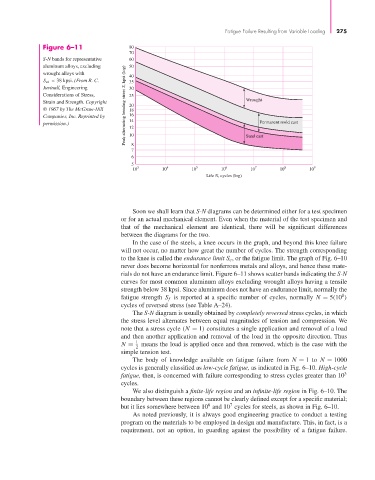
Figure 6–11 80
70
S-N bands for representative 60
aluminum alloys, excluding 50
Peak alternating bending stress S, kpsi (log) 20
wrought alloys with 40
S ut < 38 kpsi. (From R. C. 35
Juvinall, Engineering 30
Considerations of Stress, 25
Strain and Strength. Copyright Wrought
© 1967 by The McGraw-Hill 18
Companies, Inc. Reprinted by 16
Permanent mold cast
permission.) 14 Sand cast
12
10
7 8
6
5
10 3 10 4 10 5 10 6 10 7 10 8 10 9
Life N, cycles (log)
Soon we shall learn that S-N diagrams can be determined either for a test specimen
or for an actual mechanical element. Even when the material of the test specimen and
that of the mechanical element are identical, there will be significant differences
between the diagrams for the two.
In the case of the steels, a knee occurs in the graph, and beyond this knee failure
will not occur, no matter how great the number of cycles. The strength corresponding
to the knee is called the endurance limit S e , or the fatigue limit. The graph of Fig. 6–10
never does become horizontal for nonferrous metals and alloys, and hence these mate-
rials do not have an endurance limit. Figure 6–11 shows scatter bands indicating the S-N
curves for most common aluminum alloys excluding wrought alloys having a tensile
strength below 38 kpsi. Since aluminum does not have an endurance limit, normally the
8
fatigue strength S f is reported at a specific number of cycles, normally N = 5(10 )
cycles of reversed stress (see Table A–24).
The S-N diagram is usually obtained by completely reversed stress cycles, in which
the stress level alternates between equal magnitudes of tension and compression. We
note that a stress cycle (N = 1) constitutes a single application and removal of a load
and then another application and removal of the load in the opposite direction. Thus
1
N = means the load is applied once and then removed, which is the case with the
2
simple tension test.
The body of knowledge available on fatigue failure from N = 1 to N = 1000
cycles is generally classified as low-cycle fatigue, as indicated in Fig. 6–10. High-cycle
fatigue, then, is concerned with failure corresponding to stress cycles greater than 10 3
cycles.
We also distinguish a finite-life region and an infinite-life region in Fig. 6–10. The
boundary between these regions cannot be clearly defined except for a specific material;
6
7
but it lies somewhere between 10 and 10 cycles for steels, as shown in Fig. 6–10.
As noted previously, it is always good engineering practice to conduct a testing
program on the materials to be employed in design and manufacture. This, in fact, is a
requirement, not an option, in guarding against the possibility of a fatigue failure.