
Page 304 - Shigley's Mechanical Engineering Design
P. 304
bud29281_ch06_265-357.qxd 11/30/2009 4:23 pm Page 279 pinnacle s-171:Desktop Folder:Temp Work:Don't Delete (Jobs):MHDQ196/Budynas:
Fatigue Failure Resulting from Variable Loading 279
the crack is orderly. Final fracture occurs during stage III fatigue, although fatigue is not
involved. When the crack is sufficiently long that K I = K Ic for the stress amplitude
involved, where K Ic is the critical stress intensity for the undamaged metal, then there is
sudden, catastrophic failure of the remaining cross section in tensile overload (see
Sec. 5–12). Stage III fatigue is associated with rapid acceleration of crack growth then
fracture.
Crack Growth
Fatigue cracks nucleate and grow when stresses vary and there is some tension in
each stress cycle. Consider the stress to be fluctuating between the limits of σ min and
σ max , where the stress range is defined as σ = σ max − σ min . From Eq. (5–37) the
√
stress intensity is given by K I = βσ πa. Thus, for σ, the stress intensity range per
cycle is
√ √
K I = β(σ max − σ min ) πa = β σ πa (6–4)
To develop fatigue strength data, a number of specimens of the same material are tested
at various levels of σ. Cracks nucleate at or very near a free surface or large discon-
tinuity. Assuming an initial crack length of a i , crack growth as a function of the num-
ber of stress cycles N will depend on σ, that is, K I . For K I below some threshold
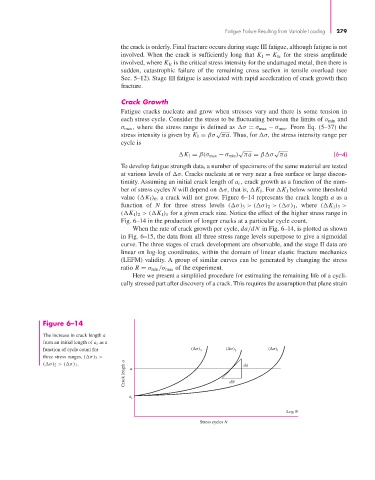
value ( K I ) th a crack will not grow. Figure 6–14 represents the crack length a as a
function of N for three stress levels ( σ) 3 > ( σ) 2 > ( σ) 1 , where ( K I ) 3 >
( K I ) 2 > ( K I ) 1 for a given crack size. Notice the effect of the higher stress range in
Fig. 6–14 in the production of longer cracks at a particular cycle count.
When the rate of crack growth per cycle, da/dN in Fig. 6–14, is plotted as shown
in Fig. 6–15, the data from all three stress range levels superpose to give a sigmoidal
curve. The three stages of crack development are observable, and the stage II data are
linear on log-log coordinates, within the domain of linear elastic fracture mechanics
(LEFM) validity. A group of similar curves can be generated by changing the stress
ratio R = σ min /σ max of the experiment.
Here we present a simplified procedure for estimating the remaining life of a cycli-
cally stressed part after discovery of a crack. This requires the assumption that plane strain
Figure 6–14
The increase in crack length a
from an initial length of a i as a
function of cycle count for (Δ ) 3 (Δ ) 2 (Δ ) 1
three stress ranges, ( σ) 3 >
Crack length a dN
( σ) 2 > ( σ) 1 . a da
a i
Log N
Stress cycles N