Page 308 - Shigley's Mechanical Engineering Design
P. 308

bud29281_ch06_265-357.qxd  11/30/2009  4:23 pm  Page 283 pinnacle s-171:Desktop Folder:Temp Work:Don't Delete (Jobs):MHDQ196/Budynas:


                                                                               Fatigue Failure Resulting from Variable Loading  283


                                                 140                                                       0.5
                                                                                           S' =    0.6
                                                                                           e
                                                           Carbon steels
                                                 120                                        S u
                                                           Alloy steels                                        0.4
                                                           Wrought irons                                    105 kpsi
                                                 100
                                                Endurance limit S' e , kpsi  80


                                                  60

                                                  40


                                                  20

                                                   0
                                                    0  20   40  60  80  100  120  140  160  180  200  220  240  260  280  300
                                                                                       , kpsi
                                                                            Tensile strength S ut
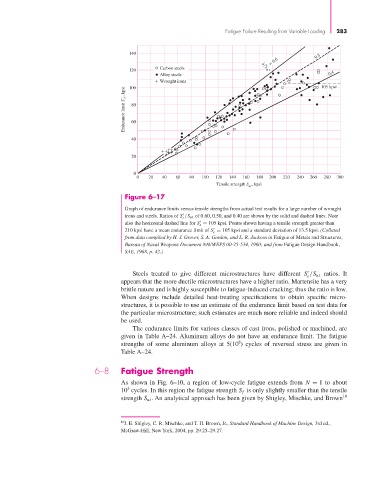
                                                Figure 6–17

                                                Graph of endurance limits versus tensile strengths from actual test results for a large number of wrought

                                                irons and steels. Ratios of S /S ut of 0.60, 0.50, and 0.40 are shown by the solid and dashed lines. Note
                                                                  e

                                                also the horizontal dashed line for S = 105 kpsi. Points shown having a tensile strength greater than
                                                                       e

                                                210 kpsi have a mean endurance limit of S = 105 kpsi and a standard deviation of 13.5 kpsi. (Collated
                                                                           e
                                                from data compiled by H. J. Grover, S. A. Gordon, and L. R. Jackson in Fatigue of Metals and Structures,
                                                Bureau of Naval Weapons Document NAVWEPS 00-25-534, 1960; and from Fatigue Design Handbook,
                                                SAE, 1968, p. 42.)

                                                  Steels treated to give different microstructures have different  S /S ut ratios. It
                                                                                                        e
                                               appears that the more ductile microstructures have a higher ratio. Martensite has a very
                                               brittle nature and is highly susceptible to fatigue-induced cracking; thus the ratio is low.
                                               When designs include detailed heat-treating specifications to obtain specific micro-
                                               structures, it is possible to use an estimate of the endurance limit based on test data for
                                               the particular microstructure; such estimates are much more reliable and indeed should
                                               be used.
                                                  The endurance limits for various classes of cast irons, polished or machined, are
                                               given in Table A–24. Aluminum alloys do not have an endurance limit. The fatigue
                                                                                   8
                                               strengths of some aluminum alloys at 5(10 ) cycles of reversed stress are given in
                                               Table A–24.

                                       6–8     Fatigue Strength

                                               As shown in Fig. 6–10, a region of low-cycle fatigue extends from  N = 1 to about
                                                 3
                                               10 cycles. In this region the fatigue strength S f is only slightly smaller than the tensile
                                               strength S ut . An analytical approach has been given by Shigley, Mischke, and Brown 10


                                               10 J. E. Shigley, C. R. Mischke, and T. H. Brown, Jr., Standard Handbook of Machine Design, 3rd ed.,
                                               McGraw-Hill, New York, 2004, pp. 29.25–29.27.
   303   304   305   306   307   308   309   310   311   312   313