Page 305 - Shigley's Mechanical Engineering Design
P. 305

bud29281_ch06_265-357.qxd  12/02/2009  9:37 pm  Page 280 pinnacle s-171:Desktop Folder:Temp Work:Don't Delete (Jobs):MHDQ196/Budynas:


                 280   Mechanical Engineering Design
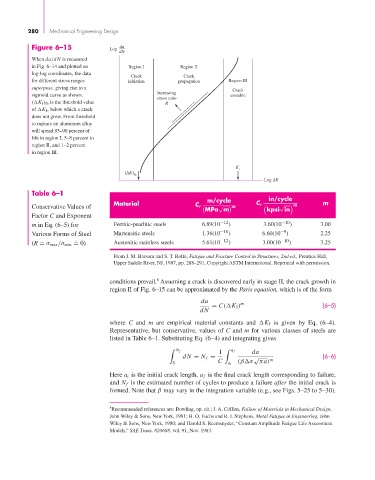
                  Figure 6–15             Log  da
                                             dN
                  When da/dN is measured
                  in Fig. 6–14 and plotted on   Region I        Region II
                  log-log coordinates, the data
                                                 Crack           Crack
                  for different stress ranges   initiation     propagation     Region III
                  superpose, giving rise to a                                   Crack
                                                         Increasing
                  sigmoid curve as shown.                                      unstable
                                                        stress ratio
                  ( K I ) th is the threshold value        R
                  of  K I , below which a crack
                  does not grow. From threshold
                  to rupture an aluminum alloy
                  will spend 85–90 percent of
                  life in region I, 5–8 percent in
                  region II, and 1–2 percent
                  in region III.

                                                                                 K c
                                               (ΔK) th
                                                                                          Log ΔK
                  Table 6–1
                                                                        m/cycle            in/cycle
                                           Material                                    C,         m         m
                  Conservative Values of                            C,     √   m              √
                                                                       MPa m              kpsi in
                  Factor C and Exponent
                  m in Eq. (6–5) for       Ferritic-pearlitic steels  6.89(10 −12 )      3.60(10 −10 )     3.00
                  Various Forms of Steel   Martensitic steels         1.36(10 −10 )      6.60(10 −9 )      2.25
                               .                                            −12                −10
                  (R = σ max /σ min = 0)   Austenitic stainless steels  5.61(10  )       3.00(10  )        3.25

                                           From J. M. Barsom and S. T. Rolfe, Fatigue and Fracture Control in Structures, 2nd ed., Prentice Hall,
                                           Upper Saddle River, NJ, 1987, pp. 288–291, Copyright ASTM International. Reprinted with permission.

                                                        8
                                          conditions prevail. Assuming a crack is discovered early in stage II, the crack growth in
                                          region II of Fig. 6–15 can be approximated by the Paris equation, which is of the form
                                                                      da          m
                                                                         = C( K I )                         (6–5)
                                                                      dN
                                          where  C and  m are empirical material constants and   K I is given by Eq. (6–4).
                                          Representative, but conservative, values of C and m for various classes of steels are
                                          listed in Table 6–1. Substituting Eq. (6–4) and integrating gives

                                                              N f              a f
                                                                            1         da

                                                                dN = N f =            √    m                (6–6)
                                                             0             C  a i  (β σ πa)
                                          Here a i is the initial crack length, a f is the final crack length corresponding to failure,
                                          and N f is the estimated number of cycles to produce a failure after the initial crack is
                                          formed. Note that β may vary in the integration variable (e.g., see Figs. 5–25 to 5–30).


                                          8 Recommended references are: Dowling, op. cit.; J. A. Collins, Failure of Materials in Mechanical Design,
                                          John Wiley & Sons, New York, 1981; H. O. Fuchs and R. I. Stephens, Metal Fatigue in Engineering, John
                                          Wiley & Sons, New York, 1980; and Harold S. Reemsnyder, “Constant Amplitude Fatigue Life Assessment
                                          Models,” SAE Trans. 820688, vol. 91, Nov. 1983.
   300   301   302   303   304   305   306   307   308   309   310