
Page 299 - Shigley's Mechanical Engineering Design
P. 299
bud29281_ch06_265-357.qxd 12/02/2009 6:49 pm Page 274 pinnacle s-171:Desktop Folder:Temp Work:Don't Delete (Jobs):MHDQ196/Budynas:
274 Mechanical Engineering Design
is the R. R. Moore high-speed rotating-beam machine. This machine subjects the specimen
to pure bending (no transverse shear) by means of weights. The specimen, shown in
Fig. 6–9, is very carefully machined and polished, with a final polishing in an axial
direction to avoid circumferential scratches. Other fatigue-testing machines are avail-
able for applying fluctuating or reversed axial stresses, torsional stresses, or combined
stresses to the test specimens.
To establish the fatigue strength of a material, quite a number of tests are necessary
because of the statistical nature of fatigue. For the rotating-beam test, a constant bend-
ing load is applied, and the number of revolutions (stress reversals) of the beam required
for failure is recorded. The first test is made at a stress that is somewhat under the ulti-
mate strength of the material. The second test is made at a stress that is less than that
used in the first. This process is continued, and the results are plotted as an S-N diagram
(Fig. 6–10). This chart may be plotted on semilog paper or on log-log paper. In the case
of ferrous metals and alloys, the graph becomes horizontal after the material has been
stressed for a certain number of cycles. Plotting on log paper emphasizes the bend in
the curve, which might not be apparent if the results were plotted by using Cartesian
coordinates.
The ordinate of the S-N diagram is called the fatigue strength S f ; a statement of
this strength value must always be accompanied by a statement of the number of cycles
N to which it corresponds.
Figure 6–9 3 in
7
16
Test-specimen geometry for the
R. R. Moore rotating-beam
machine. The bending moment a 0.30 in a
is uniform, M = Fa, over F F F F
7
9 in R.
the curved length and at the 8
highest-stressed section at the
mid-point of the beam.
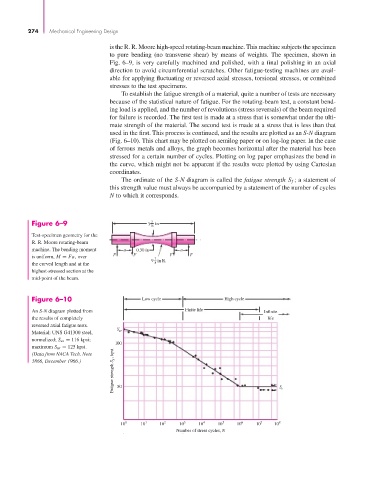
Figure 6–10 Low cycle High cycle
An S-N diagram plotted from Finite life Infinite
the results of completely life
reversed axial fatigue tests.
S
Material: UNS G41300 steel, ut
normalized; S ut = 116 kpsi;
100
maximum S ut = 125 kpsi.
Fatigue strength S f , kpsi 50 S e
(Data from NACA Tech. Note
3866, December 1966.)
10 0 10 1 10 2 10 3 10 4 10 5 10 6 10 7 10 8
Number of stress cycles, N