
Page 463 - Shigley's Mechanical Engineering Design
P. 463
bud29281_ch08_409-474.qxd 12/16/2009 7:11 pm Page 438 pinnacle 203:MHDQ196:bud29281:0073529281:bud29281_pagefiles:
438 Mechanical Engineering Design
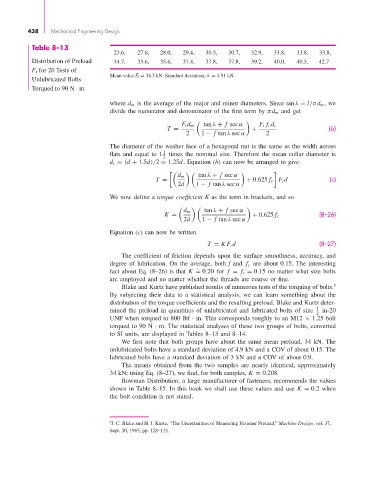
Table 8–13
23.6, 27.6, 28.0, 29.4, 30.3, 30.7, 32.9, 33.8, 33.8, 33.8,
Distribution of Preload 34.7, 35.6, 35.6, 37.4, 37.8, 37.8, 39.2, 40.0, 40.5, 42.7
F i for 20 Tests of -
Mean value F i = 34.3 kN. Standard deviation, ˆσ = 4.91 kN.
Unlubricated Bolts
Torqued to 90 N · m
where d m is the average of the major and minor diameters. Since tan λ = l/πd m , we
divide the numerator and denominator of the first term by πd m and get
F i d m tan λ + f sec α F i f c d c
T = + (b)
2 1 − f tan λ sec α 2
The diameter of the washer face of a hexagonal nut is the same as the width across
1
flats and equal to 1 times the nominal size. Therefore the mean collar diameter is
2
d c = (d + 1.5d)/2 = 1.25d. Equation (b) can now be arranged to give
d m tan λ + f sec α
T = + 0.625 f c F i d (c)
2d 1 − f tan λ sec α
We now define a torque coefficient K as the term in brackets, and so
d m tan λ + f sec α
K = + 0.625 f c (8–26)
2d 1 − f tan λ sec α
Equation (c) can now be written
T = KF i d (8–27)
The coefficient of friction depends upon the surface smoothness, accuracy, and
degree of lubrication. On the average, both f and f c are about 0.15. The interesting
.
fact about Eq. (8–26) is that K = 0.20 for f = f c = 0.15 no matter what size bolts
are employed and no matter whether the threads are coarse or fine.
Blake and Kurtz have published results of numerous tests of the torquing of bolts. 6
By subjecting their data to a statistical analysis, we can learn something about the
distribution of the torque coefficients and the resulting preload. Blake and Kurtz deter-
mined the preload in quantities of unlubricated and lubricated bolts of size 1 2 in-20
UNF when torqued to 800 lbf · in. This corresponds roughly to an M12 × 1.25 bolt
torqued to 90 N · m. The statistical analyses of these two groups of bolts, converted
to SI units, are displayed in Tables 8–13 and 8–14.
We first note that both groups have about the same mean preload, 34 kN. The
unlubricated bolts have a standard deviation of 4.9 kN and a COV of about 0.15. The
lubricated bolts have a standard deviation of 3 kN and a COV of about 0.9.
The means obtained from the two samples are nearly identical, approximately
34 kN; using Eq. (8–27), we find, for both samples, K = 0.208.
Bowman Distribution, a large manufacturer of fasteners, recommends the values
shown in Table 8–15. In this book we shall use these values and use K = 0.2 when
the bolt condition is not stated.
6 J. C. Blake and H. J. Kurtz, “The Uncertainties of Measuring Fastener Preload,” Machine Design, vol. 37,
Sept. 30, 1965, pp. 128–131.