
Page 221 -
P. 221
218 A. Evans et al.
a b
75.5 75.22
75.45
75.2
75.4
75.18
75.35
Price at Station 2 75.25 Price at Station 2 75.16
75.3
75.14
75.2
75.15
75.1 75.12
75.1
75.05
75.08
75
75.08 75.1 75.12 75.14 75.16 75.18 75.2 75.22
75 75.05 75.1 75.15 75.2 75.25 75.3
Price at Station 1
Price at Station 1
c 90 d
85
88
86 84
Price (p) Station 2 82 Price (p) at Station 2 82
84
83
80
78
81
76
74 80
79
72
70 78
69 70 71 72 73 74 75 76 77 78 73 74 75 76 77 78 79
Price (p) Station 1 Price (p) Station 1
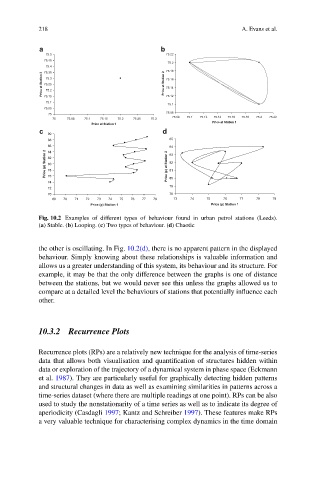
Fig. 10.2 Examples of different types of behaviour found in urban petrol stations (Leeds).
(a)Stable. (b) Looping. (c) Two types of behaviour. (d) Chaotic
the other is oscillating. In Fig. 10.2(d), there is no apparent pattern in the displayed
behaviour. Simply knowing about these relationships is valuable information and
allows us a greater understanding of this system, its behaviour and its structure. For
example, it may be that the only difference between the graphs is one of distance
between the stations, but we would never see this unless the graphs allowed us to
compare at a detailed level the behaviours of stations that potentially influence each
other.
10.3.2 Recurrence Plots
Recurrence plots (RPs) are a relatively new technique for the analysis of time-series
data that allows both visualisation and quantification of structures hidden within
data or exploration of the trajectory of a dynamical system in phase space (Eckmann
et al. 1987). They are particularly useful for graphically detecting hidden patterns
and structural changes in data as well as examining similarities in patterns across a
time-series dataset (where there are multiple readings at one point). RPs can be also
used to study the nonstationarity of a time series as well as to indicate its degree of
aperiodicity (Casdagli 1997; Kantz and Schreiber 1997). These features make RPs
a very valuable technique for characterising complex dynamics in the time domain