
Page 244 -
P. 244
242 R. Seri and D. Secchi
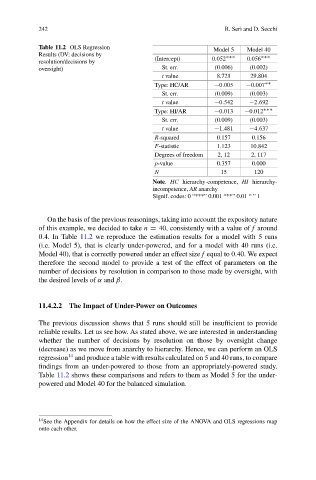
Table 11.2 OLS Regression Model 5 Model 40
Results (DV: decisions by
resolution/decisions by (Intercept) 0:052 0:056
oversight) St. err. (0.006) (0.002)
t value 8.721 29.804
Type: HC/AR 0:005 0:007
St. err. (0.009) (0.003)
t value 0:542 2:692
Type: HI/AR 0:013 0:012
St. err. (0.009) (0.003)
t value 1:481 4:637
R-squared 0.157 0.156
F-statistic 1.123 10.842
Degrees of freedom 2, 12 2, 117
p-value 0.357 0.000
N 15 120
Note. HC hierarchy-competence, HI hierarchy-
incompetence, AR anarchy
Signif. codes: 0 “***” 0.001 “**” 0.01 “ ” 1
On the basis of the previous reasonings, taking into account the expository nature
of this example, we decided to take n D 40, consistently with a value of f around
0:4. In Table 11.2 we reproduce the estimation results for a model with 5 runs
(i.e. Model 5), that is clearly under-powered, and for a model with 40 runs (i.e.
Model 40), that is correctly powered under an effect size f equal to 0:40. We expect
therefore the second model to provide a test of the effect of parameters on the
number of decisions by resolution in comparison to those made by oversight, with
the desired levels of ˛ and ˇ.
11.4.2.2 The Impact of Under-Power on Outcomes
The previous discussion shows that 5 runs should still be insufficient to provide
reliable results. Let us see how. As stated above, we are interested in understanding
whether the number of decisions by resolution on those by oversight change
(decrease) as we move from anarchy to hierarchy. Hence, we can perform an OLS
14
regression and produce a table with results calculated on 5 and 40 runs, to compare
findings from an under-powered to those from an appropriately-powered study.
Table 11.2 shows these comparisons and refers to them as Model 5 for the under-
powered and Model 40 for the balanced simulation.
14
See the Appendix for details on how the effect size of the ANOVA and OLS regressions map
onto each other.