
Page 121 - Six Sigma Demystified
P. 121
102 Six SigMa DemystifieD
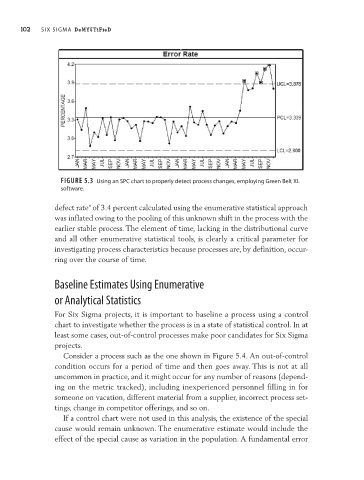
Figure 5.3 Using an SPC chart to properly detect process changes, employing green Belt xL
software.
defect rate” of 3.4 percent calculated using the enumerative statistical approach
was inflated owing to the pooling of this unknown shift in the process with the
earlier stable process. The element of time, lacking in the distributional curve
and all other enumerative statistical tools, is clearly a critical parameter for
investigating process characteristics because processes are, by definition, occur-
ring over the course of time.
Baseline estimates Using enumerative
or analytical Statistics
For Six Sigma projects, it is important to baseline a process using a control
chart to investigate whether the process is in a state of statistical control. In at
least some cases, out- of- control processes make poor candidates for Six Sigma
projects.
Consider a process such as the one shown in Figure 5.4. An out- of- control
condition occurs for a period of time and then goes away. This is not at all
uncommon in practice, and it might occur for any number of reasons (depend-
ing on the metric tracked), including inexperienced personnel filling in for
someone on vacation, different material from a supplier, incorrect process set-
tings, change in competitor offerings, and so on.
If a control chart were not used in this analysis, the existence of the special
cause would remain unknown. The enumerative estimate would include the
effect of the special cause as variation in the population. A fundamental error