
Page 122 - Six Sigma Demystified
P. 122
Chapter 5 m e a s u r e s tag e 103
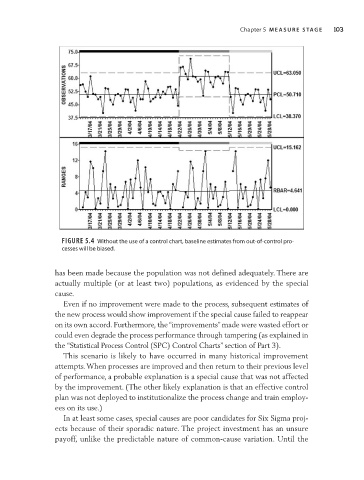
Figure 5.4 Without the use of a control chart, baseline estimates from out- of- control pro-
cesses will be biased.
has been made because the population was not defined adequately. There are
actually multiple (or at least two) populations, as evidenced by the special
cause.
Even if no improvement were made to the process, subsequent estimates of
the new process would show improvement if the special cause failed to reappear
on its own accord. Furthermore, the “improvements” made were wasted effort or
could even degrade the process performance through tampering (as explained in
the “Statistical Process Control (SPC) Control Charts” section of Part 3).
This scenario is likely to have occurred in many historical improvement
attempts. When processes are improved and then return to their previous level
of performance, a probable explanation is a special cause that was not affected
by the improvement. (The other likely explanation is that an effective control
plan was not deployed to institutionalize the process change and train employ-
ees on its use.)
In at least some cases, special causes are poor candidates for Six Sigma proj-
ects because of their sporadic nature. The project investment has an unsure
payoff, unlike the predictable nature of common- cause variation. Until the