
Page 126 - Six Sigma Demystified
P. 126
Chapter 5 m e a s u r e s tag e 107
Project examPle: Process Baseline
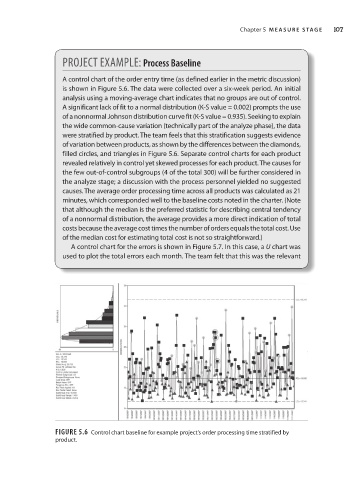
A control chart of the order entry time (as defined earlier in the metric discussion)
is shown in Figure 5.6. The data were collected over a six- week period. An initial
analysis using a moving- average chart indicates that no groups are out of control.
A significant lack of fit to a normal distribution (K- S value = 0.002) prompts the use
of a nonnormal Johnson distribution curve fit (K- S value = 0.935). Seeking to explain
the wide common- cause variation (technically part of the analyze phase), the data
were stratified by product. The team feels that this stratification suggests evidence
of variation between products, as shown by the differences between the diamonds,
filled circles, and triangles in Figure 5.6. Separate control charts for each product
revealed relatively in control yet skewed processes for each product. The causes for
the few out- of- control subgroups (4 of the total 300) will be further considered in
the analyze stage; a discussion with the process personnel yielded no suggested
causes. The average order processing time across all products was calculated as 21
minutes, which corresponded well to the baseline costs noted in the charter. (Note
that although the median is the preferred statistic for describing central tendency
of a nonnormal distribution, the average provides a more direct indication of total
costs because the average cost times the number of orders equals the total cost. Use
of the median cost for estimating total cost is not so straightforward.)
A control chart for the errors is shown in Figure 5.7. In this case, a U chart was
used to plot the total errors each month. The team felt that this was the relevant
Figure 5.6 Control chart baseline for example project’s order processing time stratified by
product.